Google Cloud: Kubernetes Measure Definitions
Learn how GCP Kubernetes measures are calculated in Ternary and how to troubleshoot missing Kubernetes metrics using Google Cloud Monitoring.
Ternary provides standardized Kubernetes measures to help you analyze cost, usage, and resource efficiency across Google Kubernetes Engine (GKE) clusters. These measures are derived from metrics collected via Google Cloud Monitoring and are used to evaluate resource requests, actual usage, and resulting waste.
Kubernetes Container Measure Definition
| Metric | Definition |
|---|---|
| limitCPUCores | Core-Days |
| limitMemoryBytes | Byte-Days |
| requestCPUCores | k8s_container.request_cpu_cores / 24.0 = requestCPUCores in Core-Days |
| requestCPUCost | (requestCPUCores) * (CPU USD Price) = Dollars |
| requestMemoryBytes | k8s_container.request_memory_bytes / 24.0 = requestMemoryBytes in Byte-Days |
| requestMemoryCost | k8s_container.request_memory_bytes * k8s_node_detail.ram_usd_price / 1073741824.0 = requestMemoryCost in USD (There are 1073741824.0 bytes per GiB) |
| totalRequestCost | requestMemoryCost + requestCPUCost = totalRequestCost in USD |
| totalWasteCost | requestMemoryCost + requestCPUCost - usedCPUCost - usedMemoryCost = totalWasteCost in USD |
| usedCPUCores | k8s_container.used_cpu_cores / 24.0 = usedCPUCores in Core-Days |
| usedCPUCost | k8s_container.used_cpu_cores * k8s_node_detail.cpu_usd_price = usedCPUCost in USD |
| usedMemoryBytes | k8s_container.used_memory_bytes / 24.0 = usedMemoryBytes in Byte-Days |
| usedMemoryCost | k8s_container.used_memory_bytes * k8s_node_detail.ram_usd_price / 1073741824.0 = usedMemoryCost in USD |
| wasteCPUs | requestCPUCores - usedCPUCores = wasteCPUs in Core-Days |
| wasteMemoryBytes | requestMemoryBytes - usedMemoryBytes = wasteMemoryBytes in Byte-Days |
| wasteCPUCost | requestCPUCost - usedCPUCost = wasteCPUCost in USD |
| wasteMemoryCost | requestMemoryCost - usedMemoryCost = wasteMemoryCost in USD |
Kubernetes Node Measure Definition
| Metric | Definition |
|---|---|
| allocatableCPUUtilization | allocatable_cpu_utilization / 24.0 = allocatableCPUUtilization |
| allocatableMemoryUtilization | allocatable_memory_utilization / 24.0 = allocatableMemoryUtilization |
| CPUCoreUsageTime | cpu_core_usage_time / 24.0 = CPUCoreUsageTime in Core-Days |
| totalCost | totalMemoryCost + totalCPUCost = totalCost in USD |
| totalCPUCores | k8s_node.total_cpu_cores / 24.0 = totalCPUCores in Core-Days |
| totalCPUCost | k8s_node.total_cpu_cores * k8s_node_detail.cpu_usd_price = totalCPUCost in USD |
| totalMemoryCost | k8s_node.total_memory_bytes * k8s_node_detail.ram_usd_price / 1073741824.0 = totalMemoryCost in USD |
| totalMemoryBytes | k8s_node.total_memory_bytes / 24.0 = totalMemoryBytes in Byte-Days |
| usedMemoryBytes | used_memory_bytes / 24.0 = usedMemoryBytes in Byte-Days |
| wasteCPUs | totalCPUCores - CPUCoreUsagetime = wasteCPUs in Core-Days |
| wasteMemoryBytes | totalMemorybytes - usedMemoryBytes = wasteMemoryBytes in Bytes |
Troubleshooting Missing Kubernetes Metrics
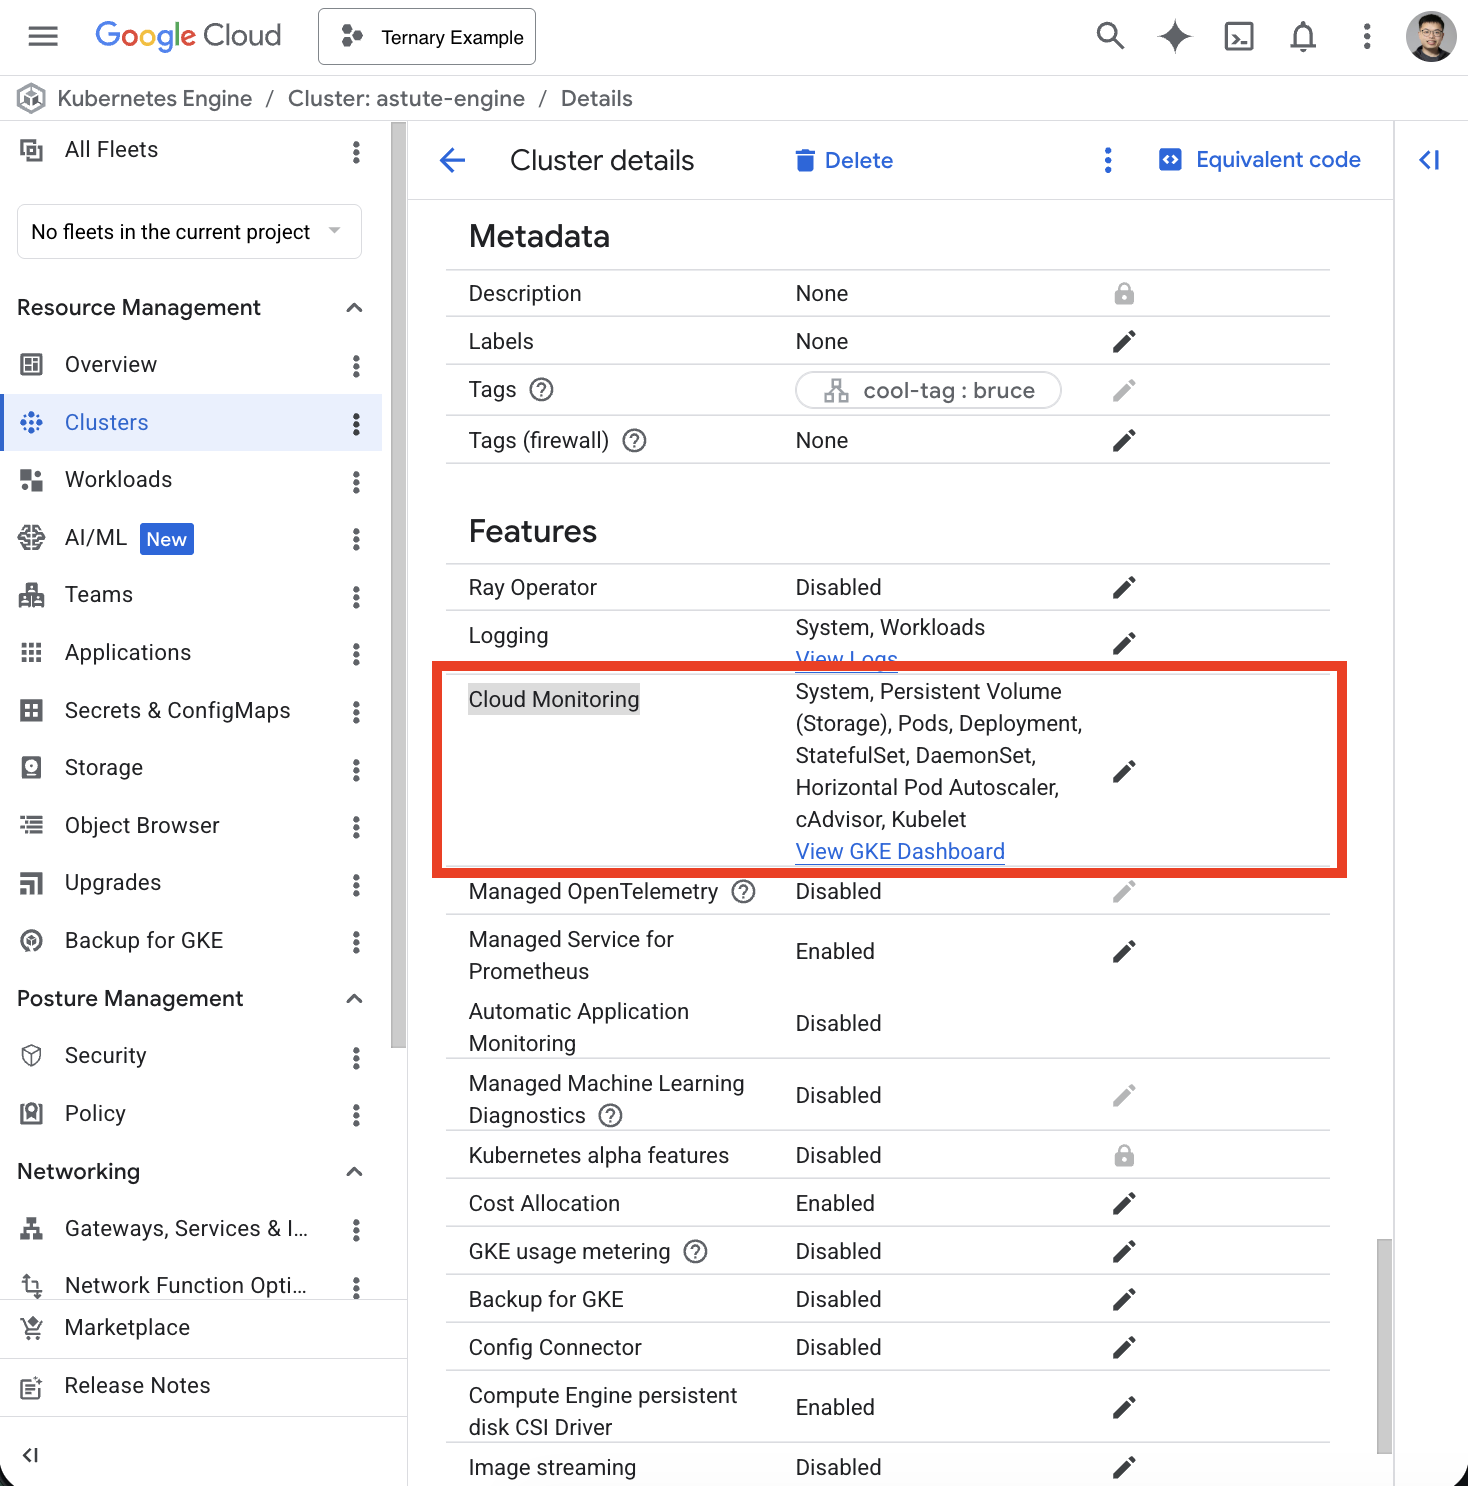
Ternary collects Kubernetes metrics using Google Cloud Monitoring, which is enabled by default for GKE clusters.
Cloud Monitoring is enabled
If Cloud Monitoring is not enabled, metrics for clusters, namespaces, workloads, and pods will not be available in Ternary.
Service account permissions
If Cloud Monitoring is enabled but metrics are still missing, the issue is typically related to permissions.
This commonly occurs when a custom service account is used instead of the default Compute Engine service account.
Ensure the following roles are assigned to the node pool service account:
- roles/logging.logWriter
- roles/monitoring.metricWriter
- roles/stackdriver.resourceMetadata.writer
Verify metrics in Google Cloud Monitoring
Confirm whether metrics are being published:
- Navigate to Metrics Explorer in Google Cloud Console
- Run the following Kubernetes metric query:
* Metric: Kubernetes Container - CPU Usage time
* Filters: project_id=your_project_id
* groupingFunction: Sum
* groupByLabels:
  * cluster_name
  * node_name
  * top_level_controller_name
  * top_level_controller_type
  * container_name
  * location
  * namespace_name
  * pod_name
* perSeriesAligner: Rate
* alignmentPeriod: 1h
If the query returns no results, Kubernetes metrics are not being published to Cloud Monitoring.
Updated 4 months ago