Ramp Plans
Learn how Ternary Ramp Plans help manage multi-year cloud commitments by modeling spend ramps, tracking actuals against contractual targets, and assessing risk before and after contract signing.
Ramp Plans in Ternary are designed to help organizations manage and de-risk multi-year cloud commitment contracts. They provide visibility into how actual spend compares against contractual obligations, how current run-rates impact future commit attainment, and where potential underspend risk exists across defined commit periods.
Ramp Plans support both pre-contract planning and post-contract monitoring. Before signing, teams can model different ramp scenarios to determine a safe commitment level. After signing, actual spend is continuously compared against projections, allowing teams to understand variance, adjust assumptions, and identify whether infrastructure changes are required to meet contractual thresholds.
Ternary Ramp Plans can be accessed from the Cost Assist section in the left-hand navigation menu.
What can Ternary Ramp Plans be used for?
Key capabilities include:
Track progress against contractual commitments
Monitor actual spend against committed amounts across defined commitment periods to understand whether usage is trending above or below required thresholds.
Understand required run-rate to meet commitments
View the spend velocity needed over the remaining contract period to stay on track, based on current usage patterns.
Incorporate discounts and offsets into commitment modeling
Account for discounts, credits, and non-billing-export adjustments that still count toward contractual obligations.
Model multiple ramp scenarios
Create and compare scenarios with different growth assumptions to evaluate risk under varying migration or adoption timelines.
Build bottom-up Ramp Plans by service or product
Allocate projected spend across services or products to identify areas of over- or under-assumption and refine forecasts accordingly.
Evaluate commitment risk before contract signing
Simulate future spend trajectories to assess what level of commitment is achievable and defensible before entering long-term agreements.
Measure the impact of actual spend on projected outcomes
Continuously compare real usage against planned ramps to understand how deviations affect the likelihood of meeting commitments.
Ramp Plans combine visibility into current commitment health with scenario-based modeling to support both planning and ongoing financial governance.
How does Ramp Plan visibility work in Ternary?
Ramp Plan visibility offers a high-level summary of how an organization is tracking against its contractual cloud spend commitments. The initial view surfaces key commitment metadata and risk indicators to help assess whether current spending trends are sufficient to meet contractual obligations.
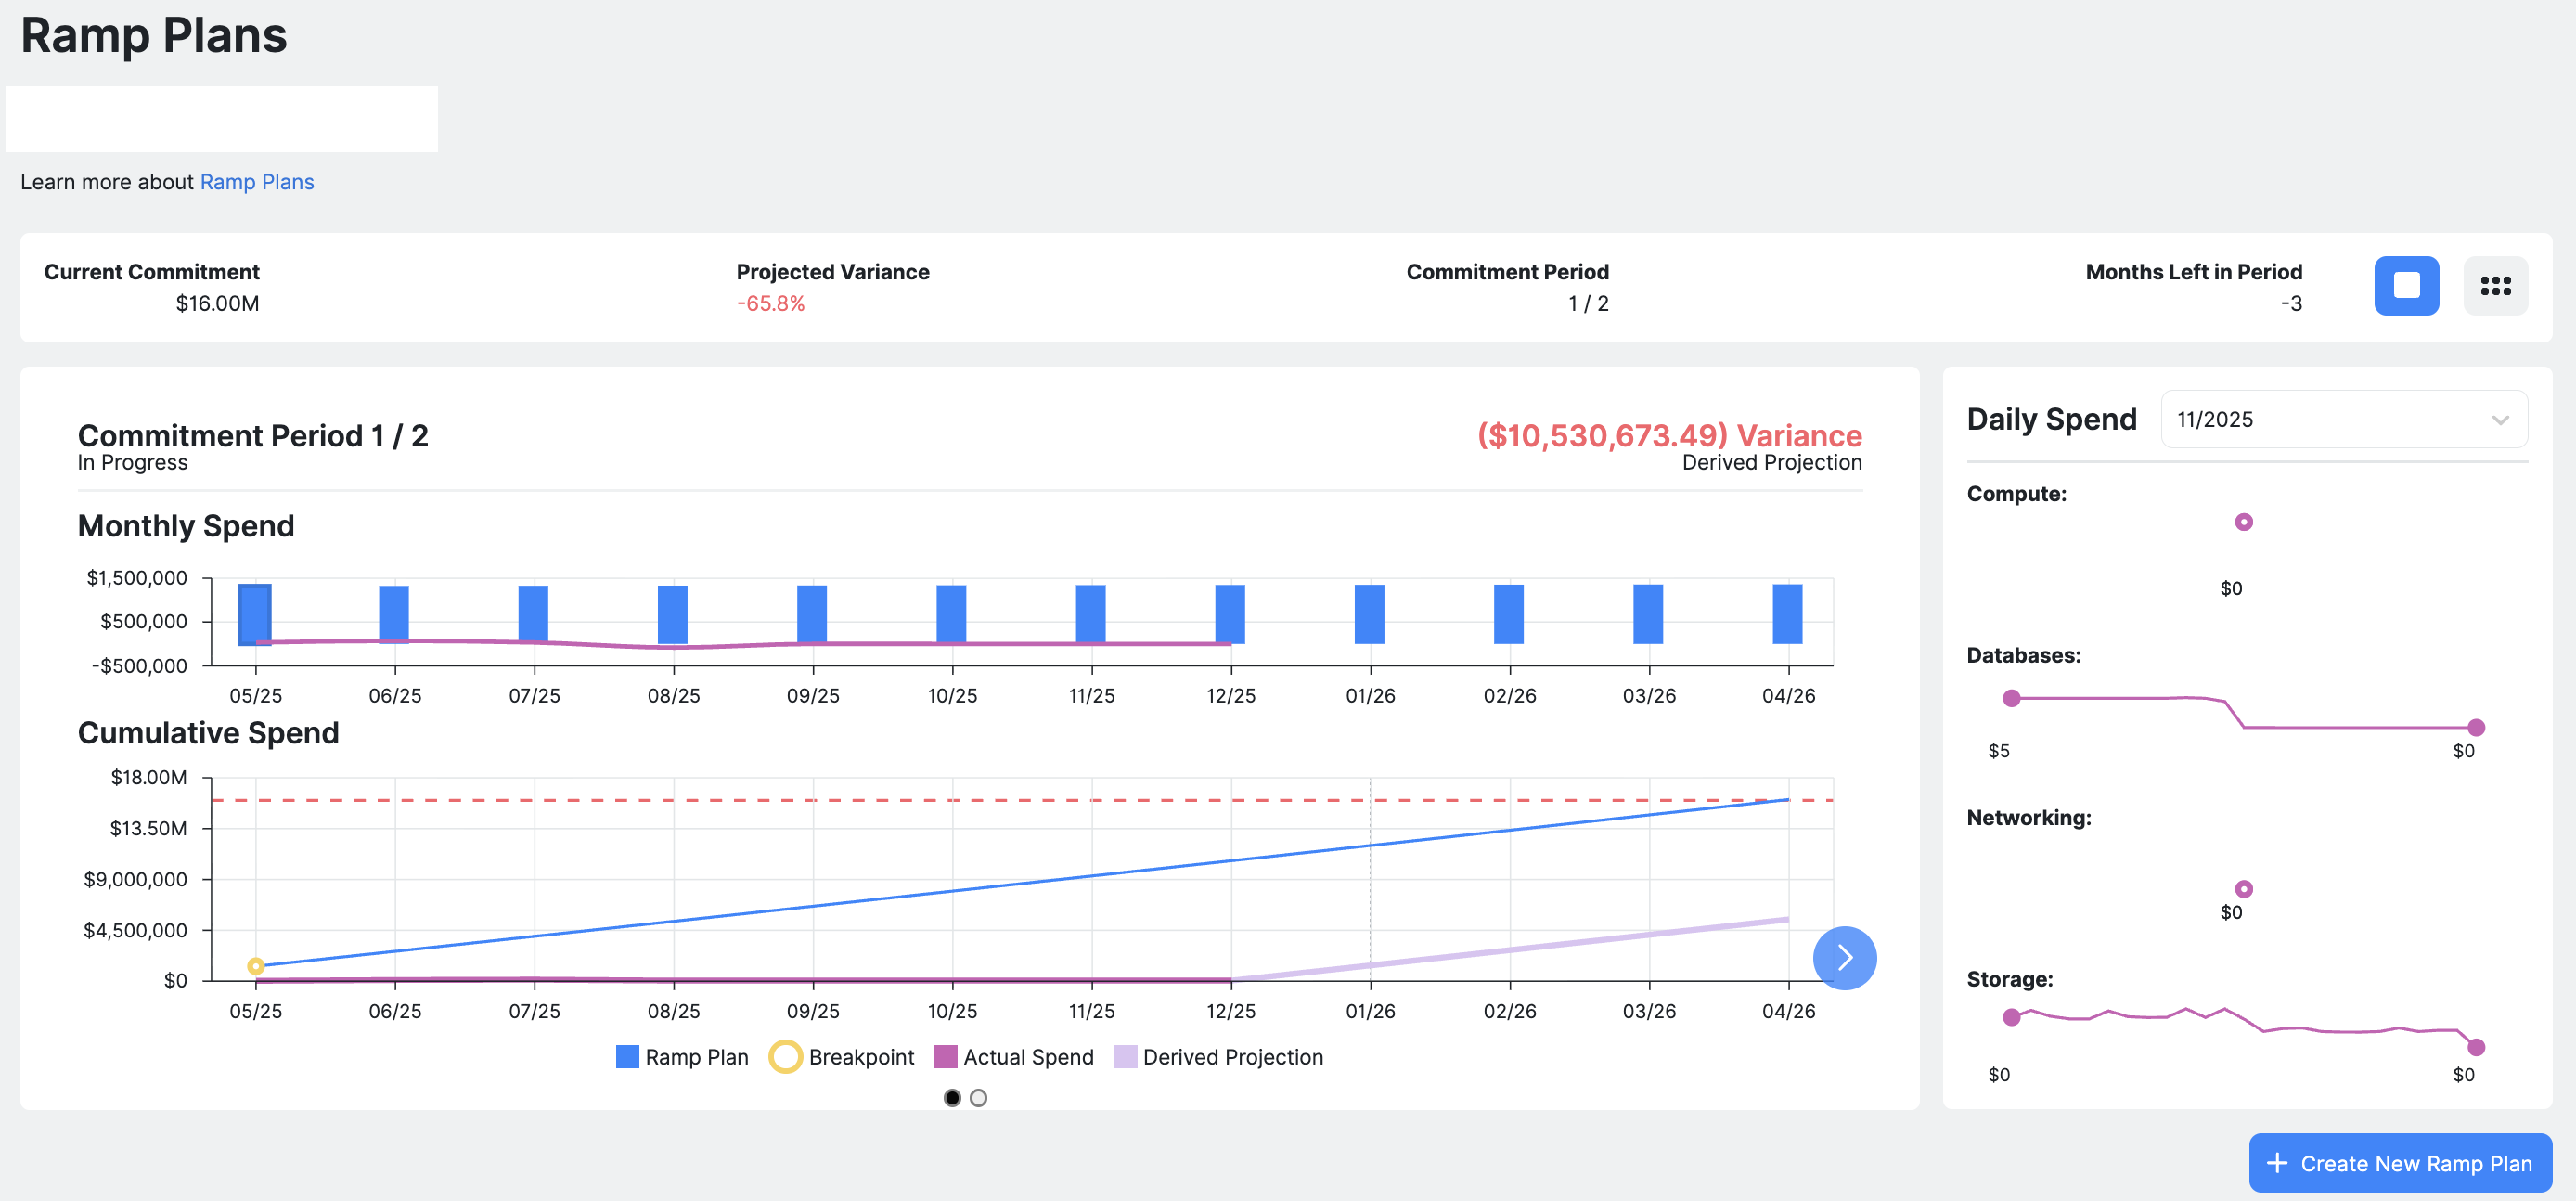
This view includes:
- The committed spend amount for the active commitment period
- Variance between projected spend and the committed amount, based on current run rate and modeled projections
- The active commitment period, accounting for contracts with multiple commit gates
- The number of months remaining in the current commitment period
A negative variance highlighted in red indicates a risk of underspending, meaning the organization may not meet the minimum contractual commitment unless spend patterns change.
How to create a Ternary Ramp Plan?
Ramp Plans are created from the Ramp Plans management page. Selecting the Create Ramp Plan button opens the configuration flow, where scenarios can be modeled against contractual commitment periods.

Step 1: Name the Ramp Plan scenario
Each Ramp Plan begins with a scenario name. This name is used to distinguish between different commitment assumptions or modeling approaches and makes it easier to compare scenarios later from the Ramp Plan list.
Step 2: Define commitment periods and amounts
Ramp Plans are modeled against one or more commitment periods defined in the contract. Each period must be entered separately with its own start date, end date, and committed amount.
Contracts frequently include multiple commitment gates across a multi-year term. These should not be aggregated into a single period.
Example:
- Commit Period 1: 01/01/2021 – 12/31/2021, $5M
- Commit Period 2: 01/01/2022 – 06/30/2023, $8M
- Commit Period 3: 07/01/2023 – 12/31/2023, $6M
In this case, each period is modeled independently rather than treating the full contract as a single commitment window.
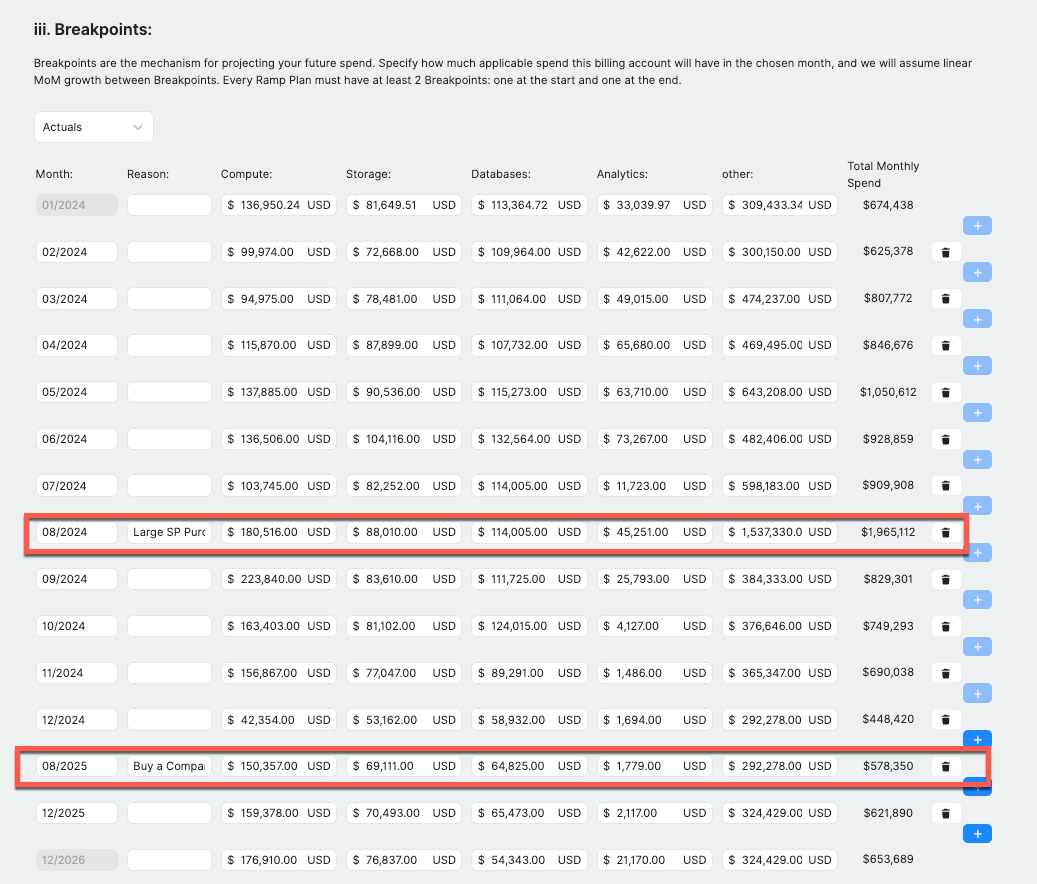
Step 3: Model spend using breakpoints
Ramp Plans are modeled using breakpoints, which represent points in time where spend is expected to change.
A breakpoint (as per Ternary modeling) represents a point in time where spend is expected to shift to a new level. Instead of manually entering projected spend for every month, breakpoints allow key moments of change to be defined, and Ternary models the spend between those points.
For example, during a cloud migration, spend may start low and increase over time. A Ramp Plan can reflect this by setting an initial breakpoint at $5,000 per month in the first month and another at $100,000 per month in the sixth month. Rather than defining monthly values for every intermediate month, breakpoints allow these changes in spend to be captured at specific points in time.
These two values are entered as:
Breakpoint 1 starting in Month 1 at $5,000
Breakpoint 2 starting in Month 6 at $100,000
Ternary then automatically models the months between these breakpoints using linear growth. This removes the need to manually define month-by-month projections while still reflecting expected ramp behavior.
Each Ramp Plan requires at least two breakpoints: one at the start of the commitment period and one at the end. Additional breakpoints can be added wherever changes in spend are anticipated, such as new migrations, product launches, or scaling events.
Step 4 (Optional): Apply manual offsets
Some costs count toward contractual commitments but do not appear directly in cloud billing exports. Common examples include reseller discounts or charges applied outside standard billing data.
Manual offsets can be added as one-time offsets as well as recurring offsets. These are incorporated into the Ramp Plan timeline to reflect a more accurate picture of commitment risk and actual spend contribution.
Step 5 (Optional): Create multi-dimensional projections
Ramp Plans can be broken down by service or category to model spend at a more granular level.
For example during a migration, separate projections can be defined for compute, storage, analytics, or other service groupings. If these categories do not cover total spend, a catch-all category can be used for the remainder.
When multi-dimensional projections are enabled:
- Each category appears independently in the visibility view
- Daily spend trends can be tracked per category
- Over- or under-spend can be identified at a service level rather than only in aggregate
This enables more precise modeling and earlier detection of risk within specific areas of spend.
Where can all Ramp Plans be reviewed and managed?
At the bottom of the Ramp Plans management page, a consolidated list displays all created Ramp Plans along with high-level statistics.
This list includes:
- Estimated variance from commitment
- Associated commitment details
- Scenario-level summaries for quick comparison
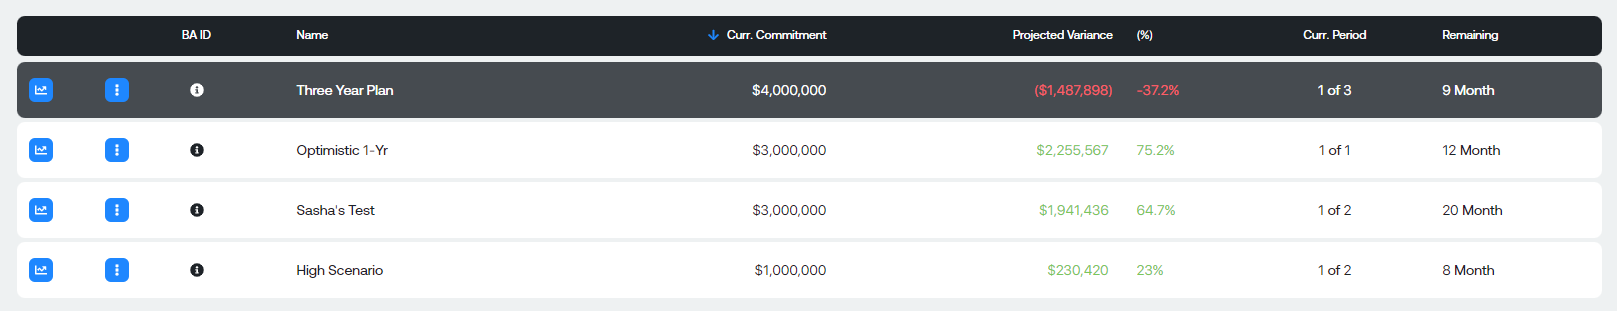
Selecting the blue chart icon in the left column switches the active chart view to the corresponding Ramp Plan scenario. This section serves as the primary entry point for reviewing, selecting, and comparing multiple Ramp Plan scenarios.
Graph Views in Ternary Ramp Plans
The Ramp Plans management page includes multiple graph views designed to show both monthly and cumulative progress toward contractual commitments, as well as day-to-day spend behavior.
Monthly Graph
The monthly graph gives you the ability to visualize how your actual spend is tracking against your budgeted Ramp Plan.
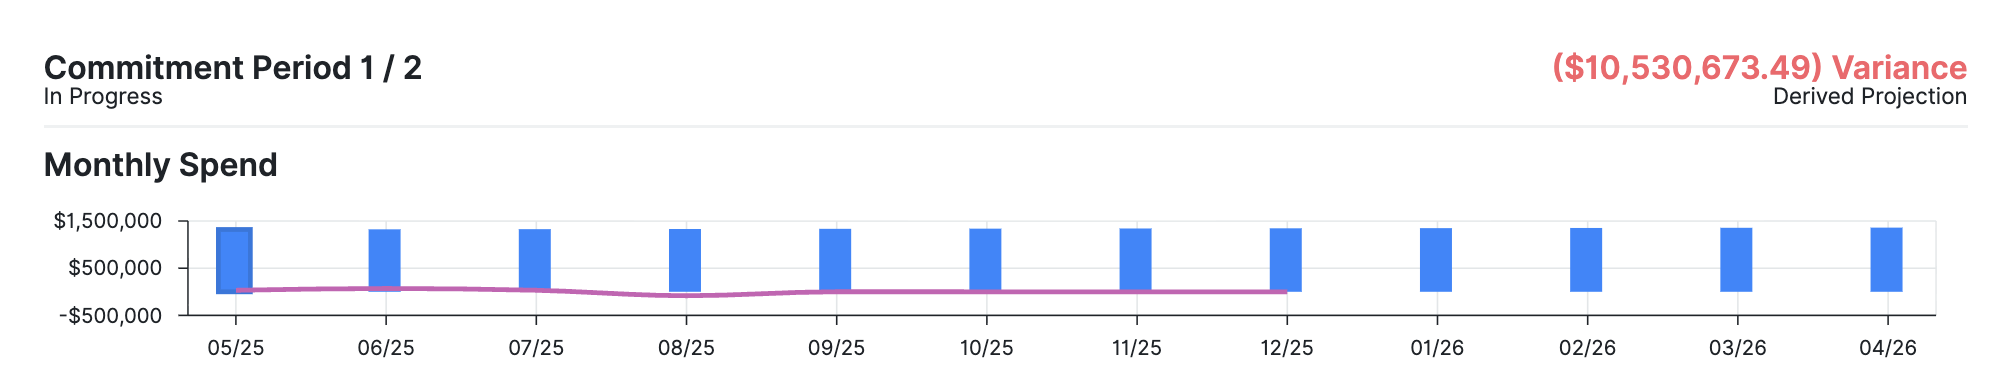
- Blue bars represent the projected spend defined in the Ramp Plan scenario
- Pink line represents actual spend for each month
When the Pink line exceeds the Blue bar, actual spend has outpaced the original projection for that month. Hovering over the graph reveals detailed values for both actuals and projected spend, enabling quick month-level comparisons.
Cumulative Spend Graph
The Cumulative Spend graph shows whether total spend is trending toward meeting the contractual commitment over time.
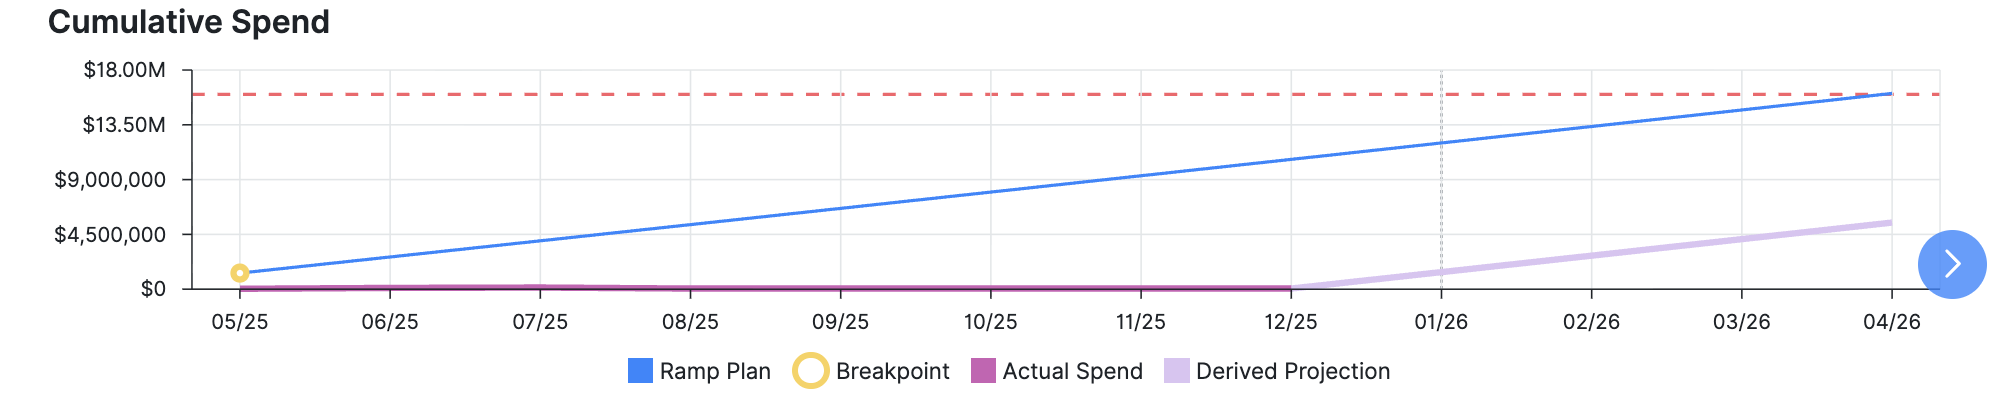
This view includes:
- Ramp Plan projection, representing the modeled cumulative spend
- Actual Spend, reflecting total spend incurred up to the current period
- Derived Projection, which adjusts future projections based on actual spend to date while preserving the original Ramp Plan assumptions
- Breakpoints, representing modeled changes in spend velocity
- Commitment Line, shown as a red dotted line indicating the total spend required to satisfy the commitment
This visualization provides a clear indication of whether current and projected spend will reach the required commitment amount within the defined period.
Daily Spend Trends
Daily Spend Trends provide a more granular view of how spend behaves within a month, especially when Ramp Plans are modeled by categories or services. This view helps identify which areas are tracking above or below planned spend on a day-by-day basis.
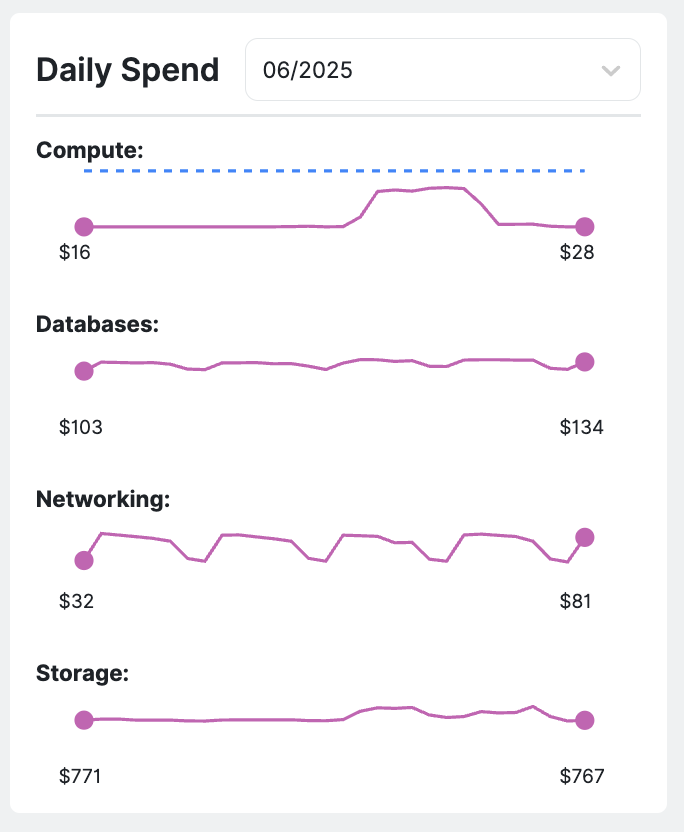
- The blue line represents the expected daily spend, calculated by evenly distributing the monthly Ramp Plan projection across the number of days in the month. This line remains flat, serving as a baseline for comparison.
- The pink line shows actual daily spend. When the pink line consistently sits above the blue line, it indicates overspending for that category or service. When it stays below, spend is trending under the planned projection.
This view is also useful for spotting anomalies. Sudden spikes or drops in daily spend can be quickly identified and traced back to specific categories, helping isolate the source of irregular usage or unexpected cost behaviour.
Updated 6 months ago