Budgets
Learn how Ternary Budgets help teams track cloud spend against defined targets, monitor projected usage, and receive alerts to prevent overspending.
Budgets in Ternary are used to define spend targets for specific cloud scopes and monitor actual and projected usage against those targets. They support tracking spend across providers, services, and custom groupings, helping teams identify when costs are trending above expectations.
Budgets also support flexible modeling to account for growth patterns, seasonality, and provider-specific billing structures. Key capabilities include:
- Variable monthly budgets, allowing different budget amounts to be defined for each month within a budget period.
- Percentage-based increases, enabling consistent month-over-month budget growth modeling.
- Historical spend autofill, which pre-populates monthly budget values using past usage data.
- Spend trend previews, surfacing historical usage patterns during budget configuration to guide decision-making.
- Expanded dimension support, including cloud provider-specific (non-FOCUS) billing dimensions from AWS, Azure, and Google Cloud.
Budgets can be configured with thresholds and alerts to notify stakeholders as spend approaches or exceeds defined limits. This allows teams to intervene early, understand which assets are driving variance, and maintain control over cloud costs throughout the month.
Budgets can be accessed from the Cost Assist section in the left-hand navigation menu.
How to create a budget in Ternary
Creating a budget in Ternary involves defining the scope of spend to track, setting a target amount, and optionally configuring alerts to monitor budget performance.
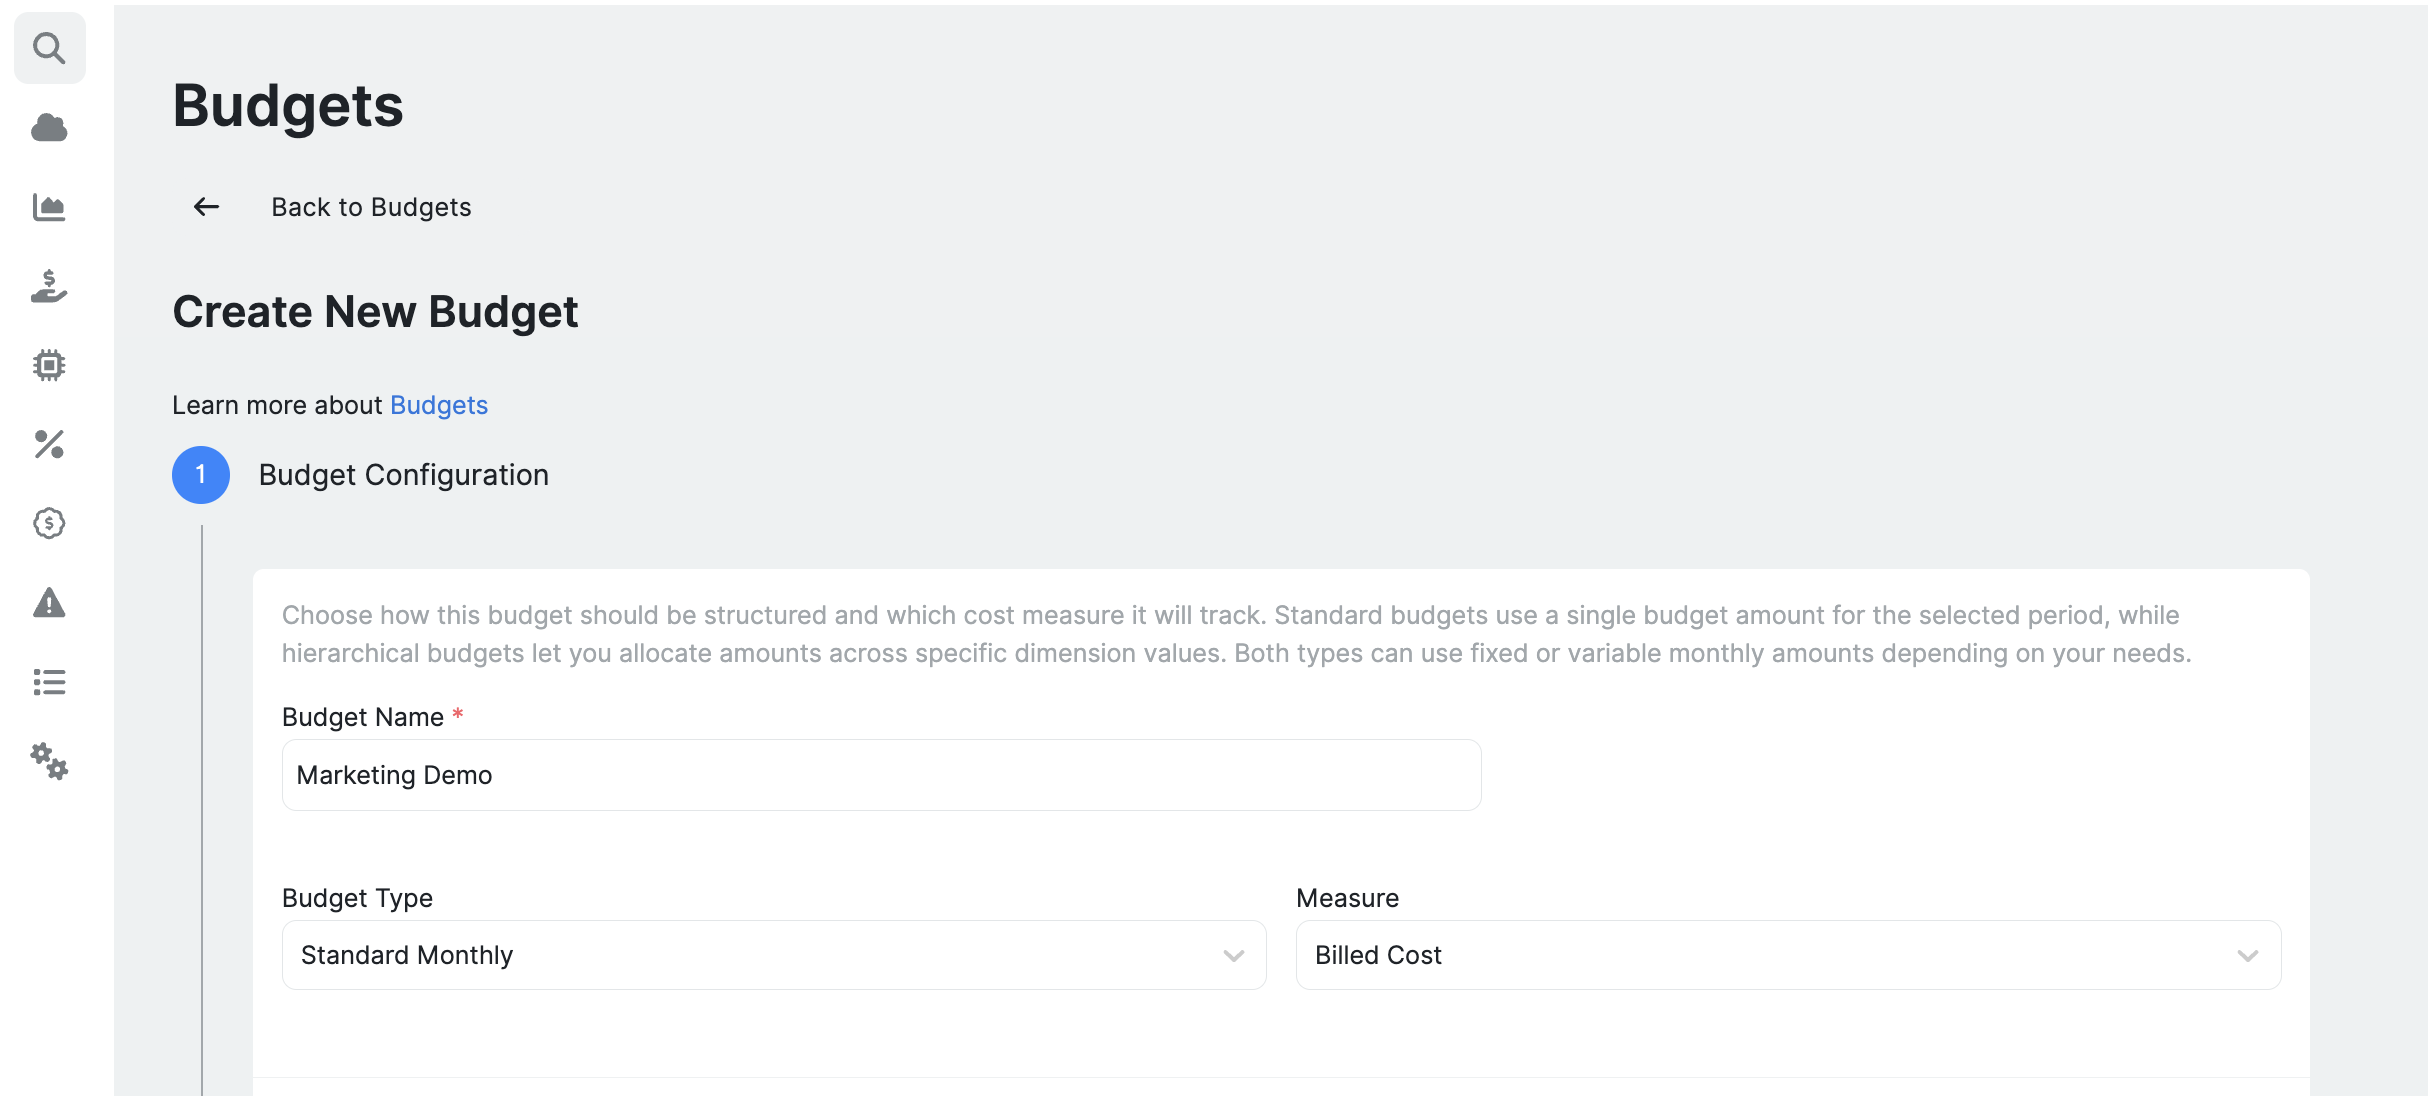
Step 1: Define budget details and scope
- Define the budget name: Provide a clear, descriptive name that reflects the purpose and scope of the budget. This helps identify and distinguish the budget during monitoring and reporting.
- Select the cost measure: Choose the cost measure the budget will track. Budgets can be based on billed cost, which reflects actual invoiced amounts, or effective cost, which accounts for applied discounts and credits.
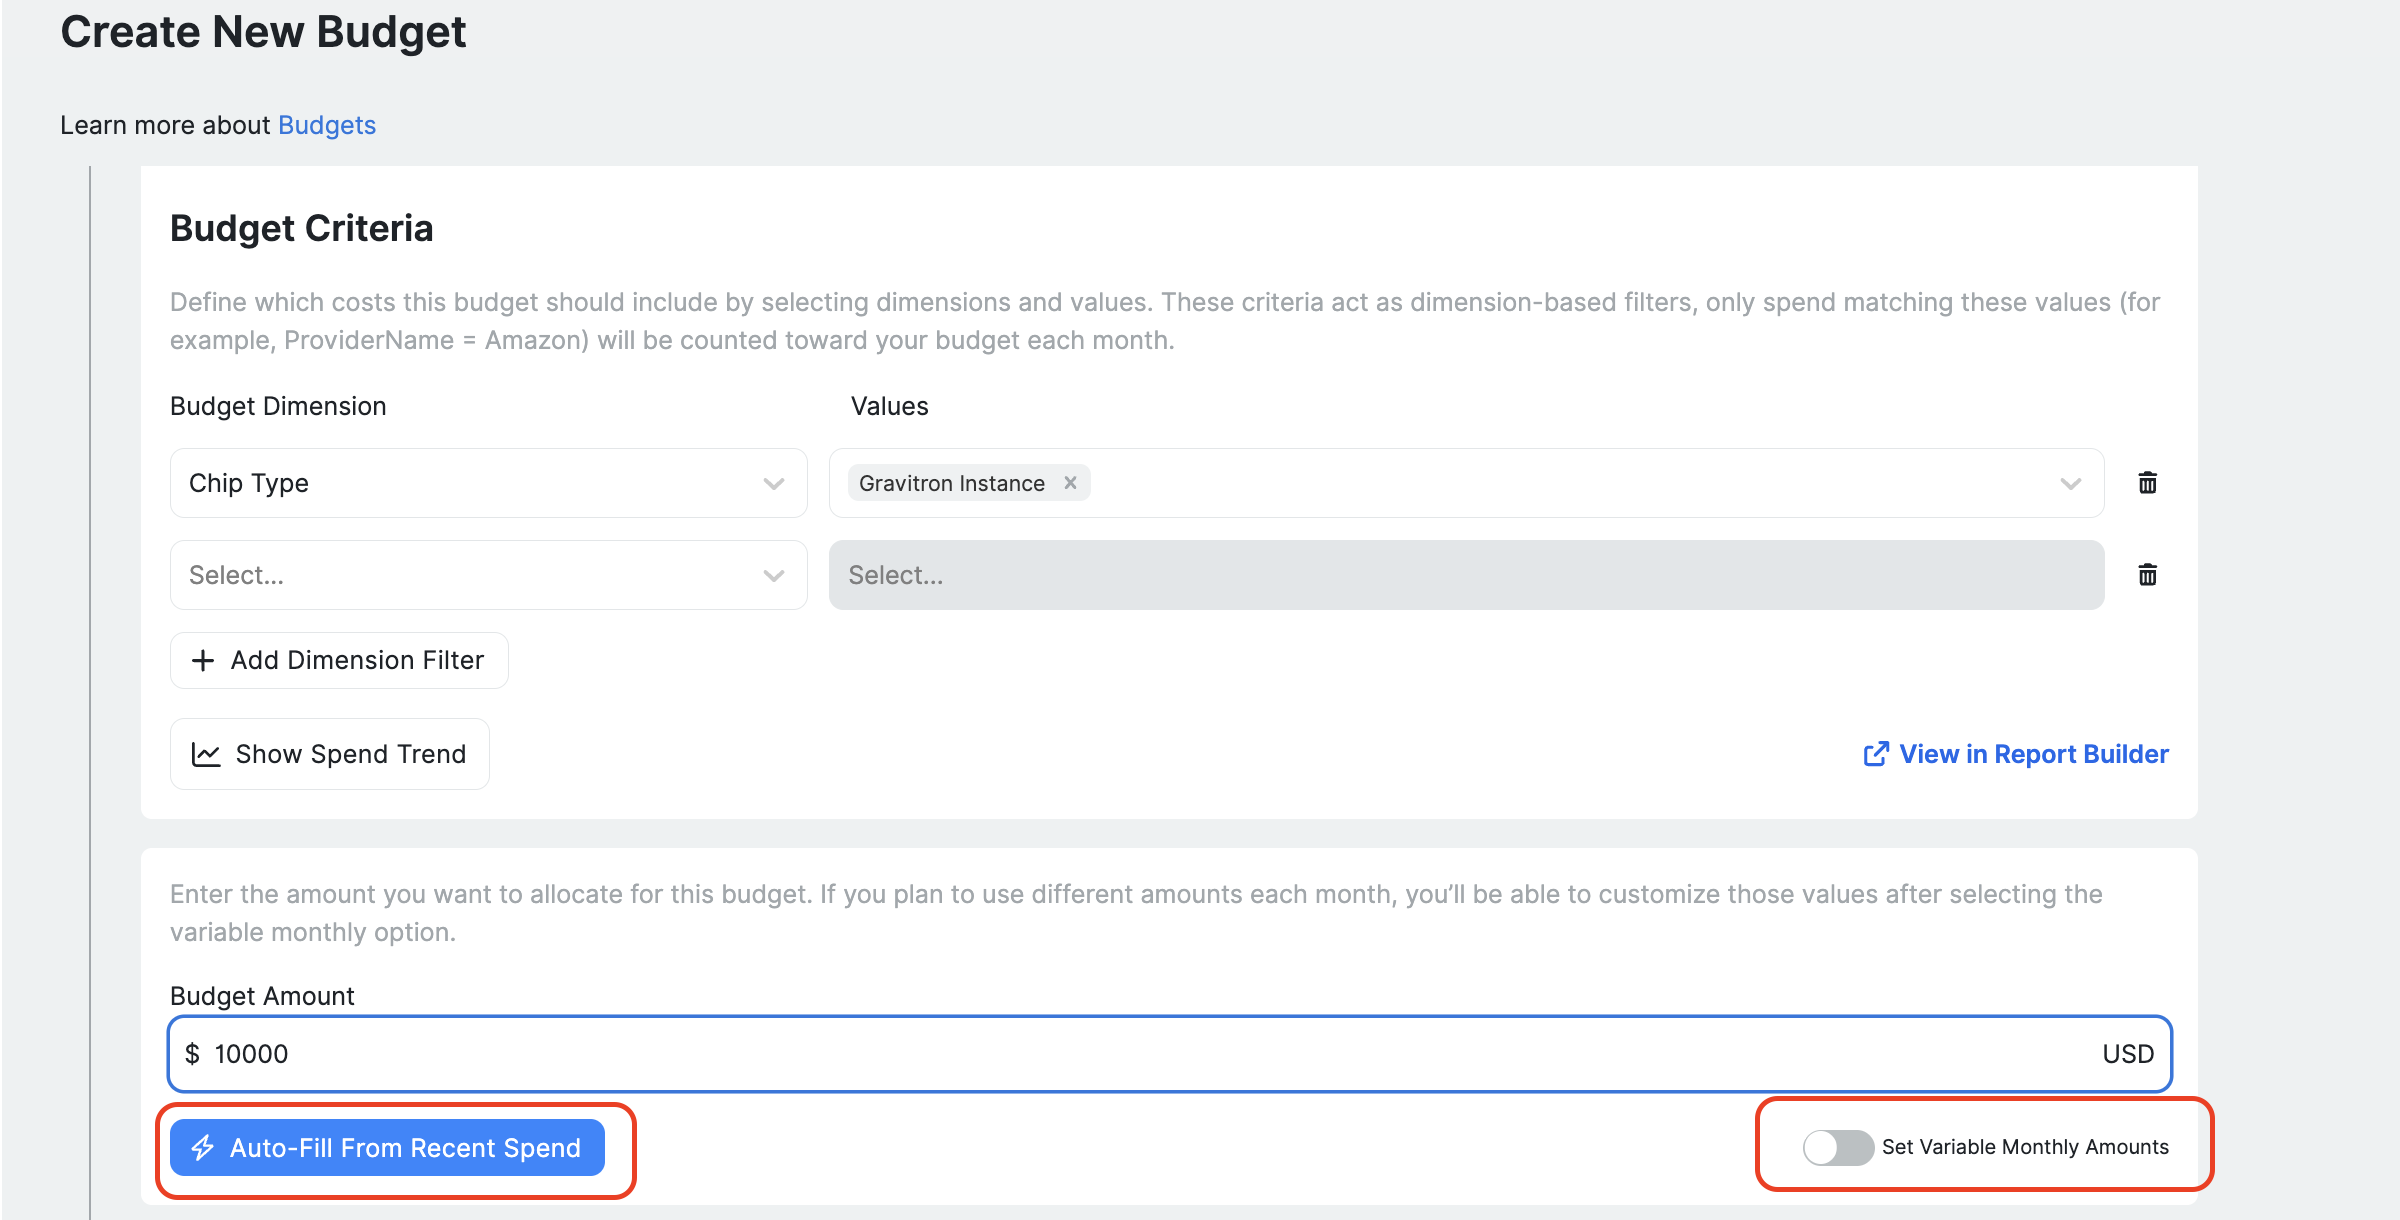
- Define the scope: Specify the scope of the budget by selecting one or more groupings and narrowing them down using sub-dimensions. This determines which cloud assets, providers, or environments are included in the budget calculation.
-
Choose the budget type: Select how the budget amount should be defined.
- Standard Monthly: Defines a primary monthly budget amount. This budget type also supports variable monthly values within the same configuration. When a dimension and value are selected, monthly amounts can be adjusted to differ across the budget period, allowing budgets to account for seasonality, growth, or planned changes in spend. Monthly values can be entered manually, increased by a percentage, or pre-filled using historical spend data.
- Hierarchical Budget: Budget amounts allocated across multiple scope values, requiring individual amounts per scope.
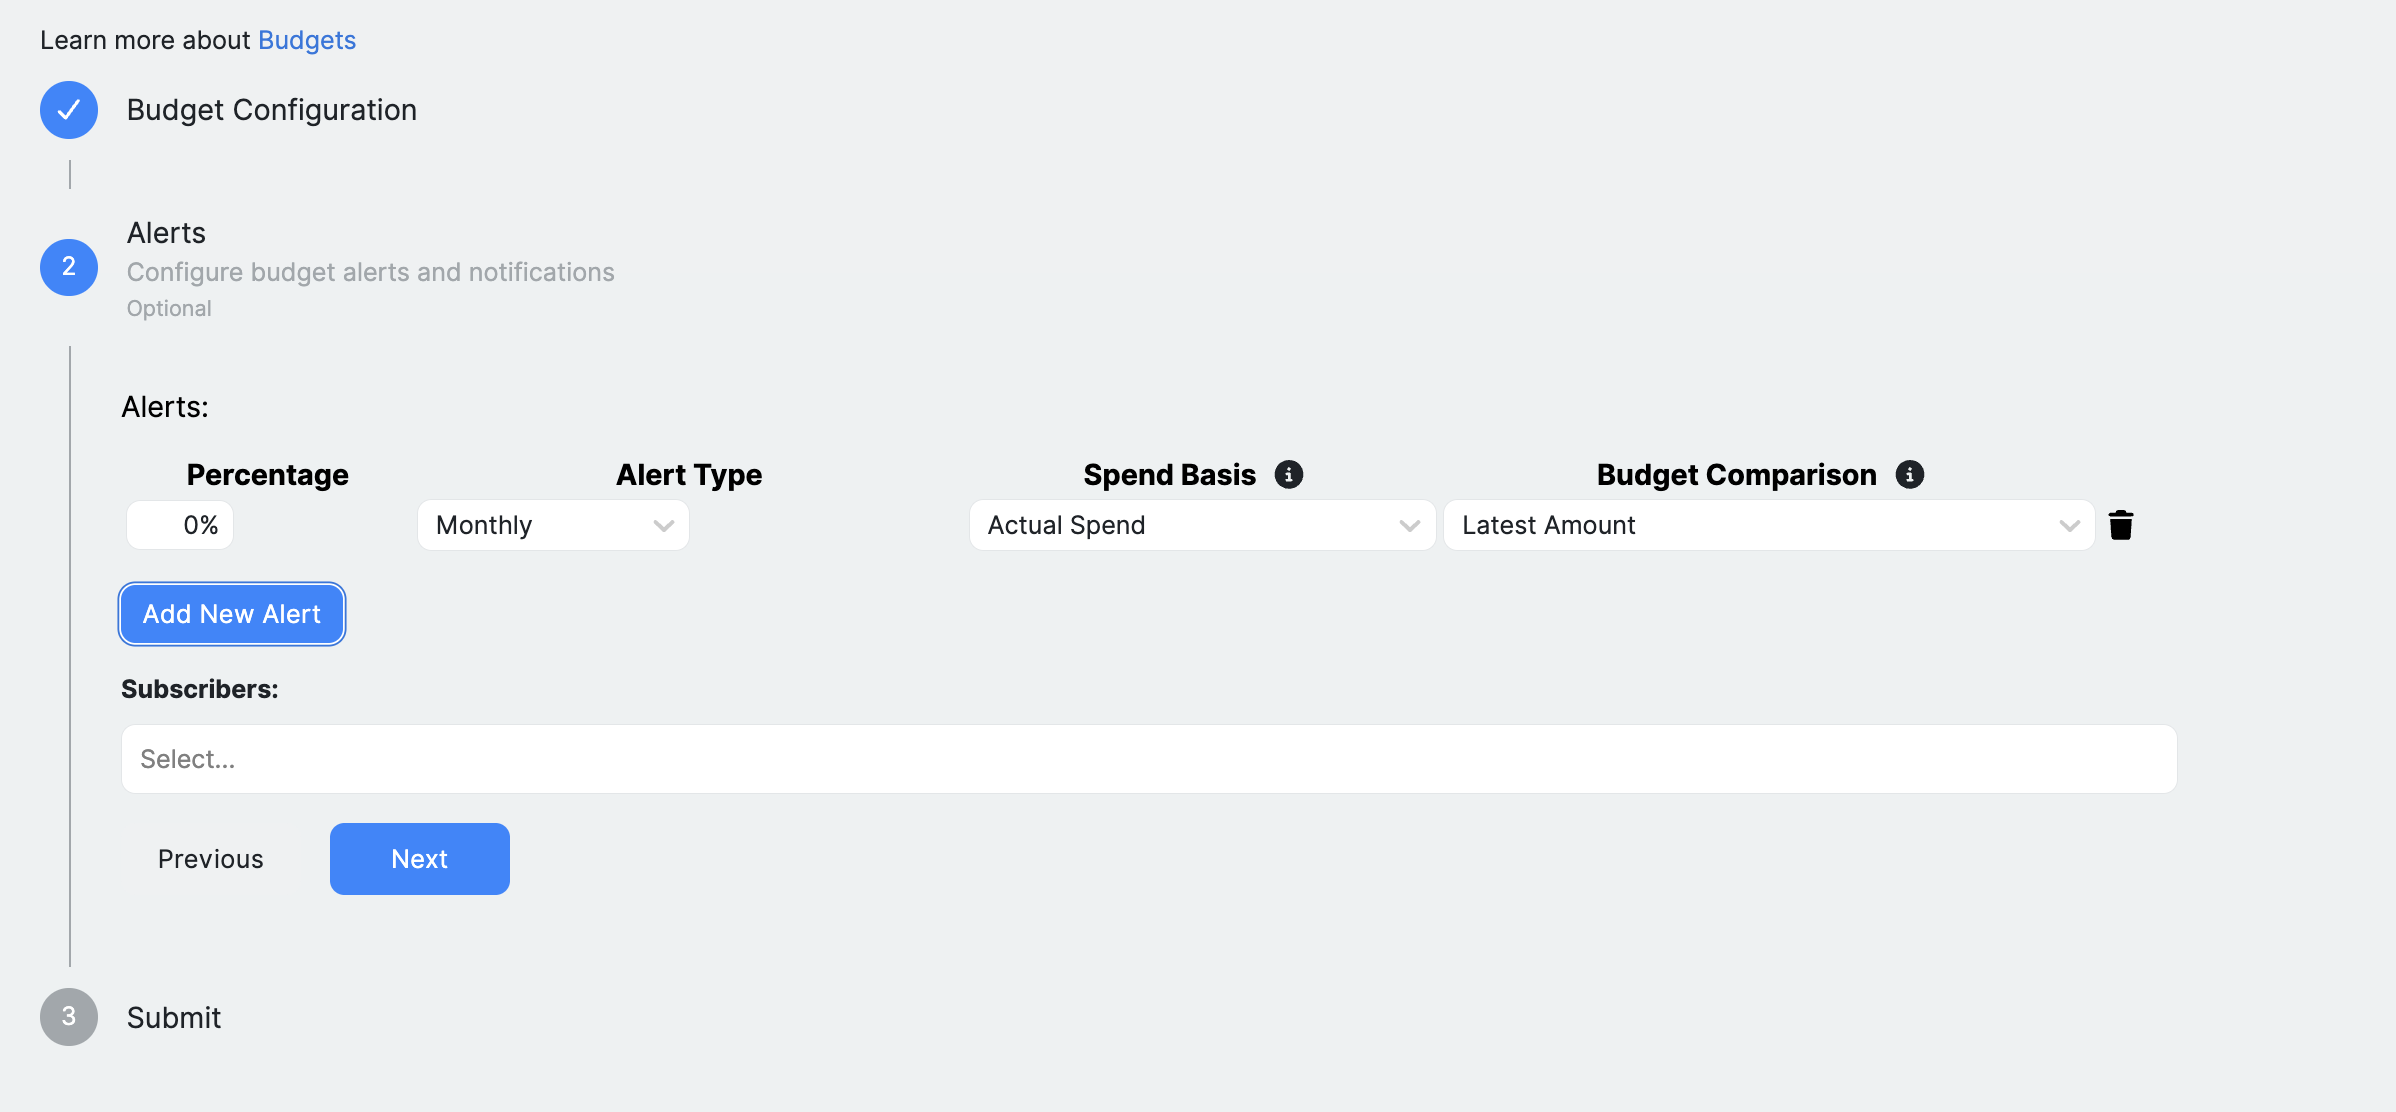
Step 2: Configure alerts and notifications (optional)
Alerts can be configured to notify stakeholders when spend approaches or exceeds defined thresholds.
To configure alerts:
- Define a threshold percentage that triggers an alert.
- Select an evaluation frequency, either monthly or daily.
- Choose the spend basis, using actual spend or projected spend based on current trends.
- Specify the comparison method, either against the latest billing data or a reference baseline.
- Add subscribers who should receive alert notifications via email.
Step 3: Review and submit
Before saving the budget, review all configured settings, including scope, budget amount, and alert rules. Once confirmed, submit the budget to begin tracking spend against the defined target.
How are budgets managed in Ternary
The Budget Management page provides a centralized table view of all configured budgets. It is used to monitor budget performance, assess risk, and take action when spend deviates from planned targets.
For each budget, the table surfaces key metrics including:
- Total Amount: The defined budget value for the selected period.
- Month-to-Date (MTD) Spend: The actual spend incurred so far within the current month.
- Projected Spend: An estimate of total month-end spend, calculated using a linear extrapolation of MTD spend. For workloads with uneven usage patterns, this projection may overestimate or underestimate final spend.
- Variance: Calculated as [Projected Spend] – [Budget], this value highlights budgets or scopes that are most at risk of exceeding their limits.
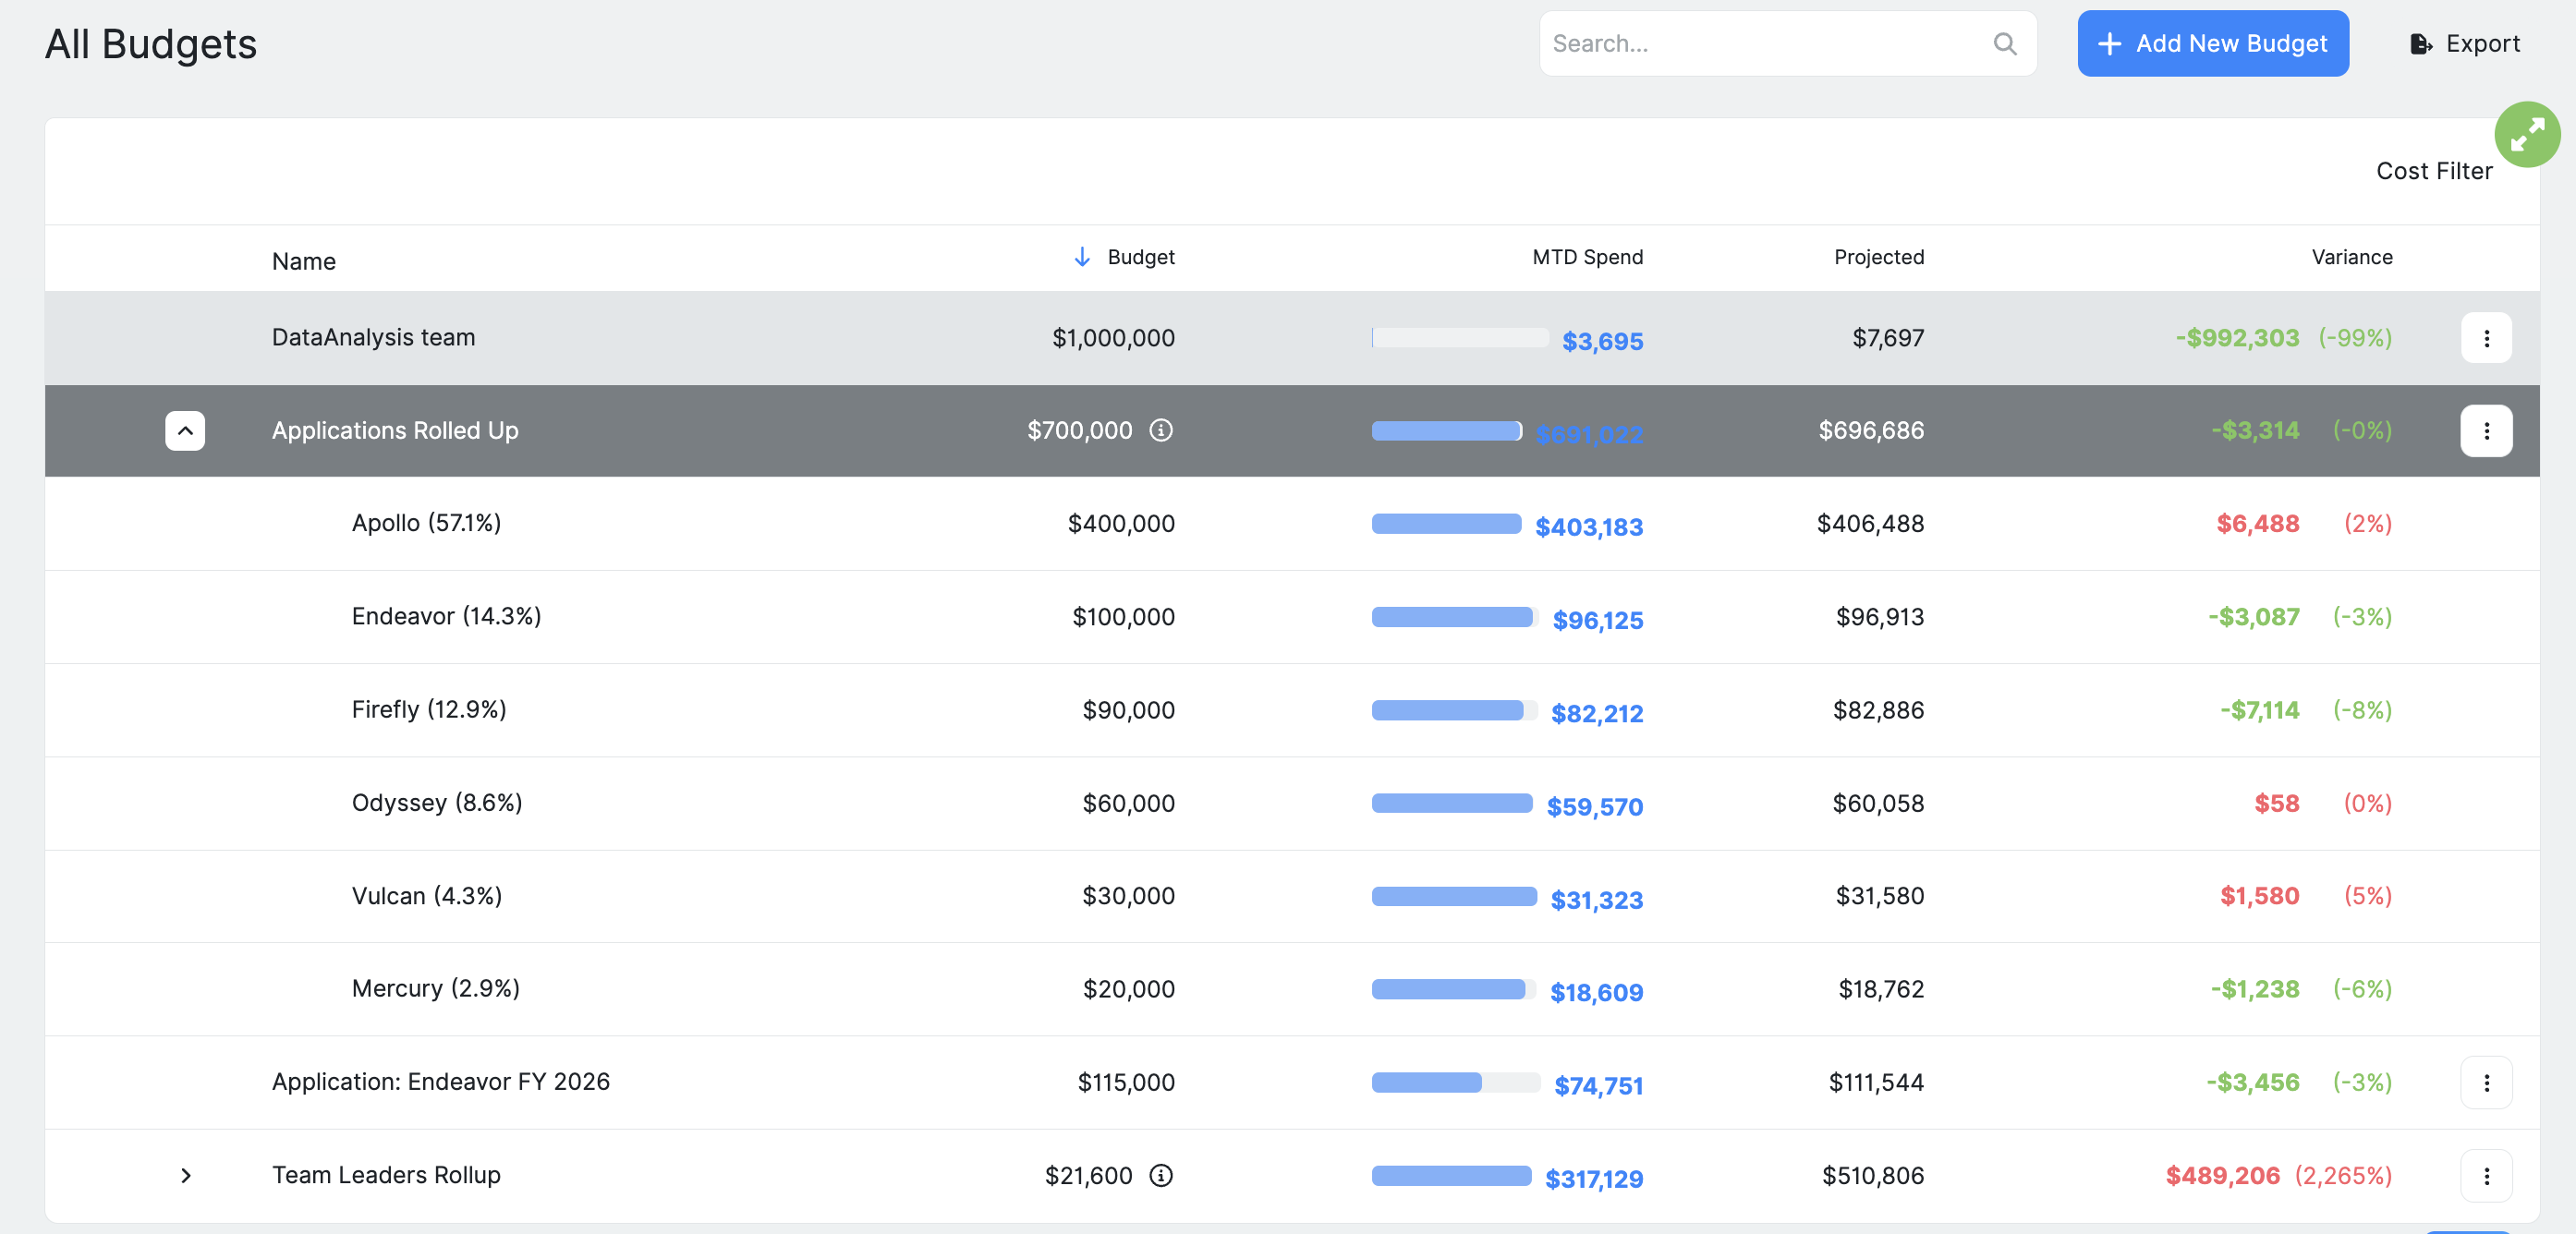
Selecting a budget opens a detailed overview above the table, which includes visualizations for deeper analysis. Additionally, each budget row includes an ellipsis menu with options to edit, copy, delete, or add the budget to a preferred dashboard for easier monitoring.
The Budget Management table also supports flexible analysis through custom date ranges when comparing actuals against budgets. Budgets can also be filtered by amount to focus on specific cost thresholds or ranges.
What budget views are available in Ternary?
Daily Trends
The Daily Trends view overlays daily spend patterns across multiple months to help identify how usage behaves over time.
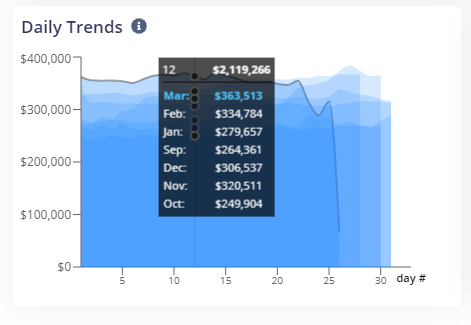
- The dark shaded line represents daily spend for the current month.
- Lighter shaded lines represent daily spend from previous months, overlaid for comparison.
- Hovering over the graph reveals daily spend values across the past six months.
This view helps answer critical questions about workload behavior:
- Is spend typically front-loaded, back-loaded, or evenly distributed across the month?
- If a budget threshold is crossed early in the month, does it indicate a genuine risk, or is that pattern consistent with historical behavior?
For example, if spend is consistently front-loaded every month, an early spike may not indicate a budget issue. Conversely, a deviation from historical patterns can signal emerging risk.
Current Month
The Current Month view shows how actual and projected spend compares to the defined budget for the ongoing month.
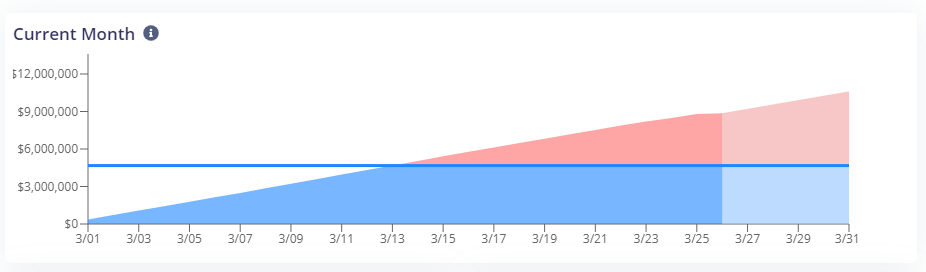
- Monthly budget: Displayed as a horizontal blue line, representing the total budget allocated for the month.
- Month-to-date (MTD) spend: Shown as a dark shaded area, indicating the actual spend incurred so far in the current month.
- Projected end-of-month spend: Represented by a lighter shaded area, calculated using Ternary’s forecast based on current usage trends. The forecast is derived as:
Current month-to-date spend + (average spend over past 30-days * days remaining in month)- Over-budget indication: A red shaded area appears when actual or projected spend exceeds the defined budget, highlighting potential budget risk.
Monthly Trends
The Monthly Trends view shows how total monthly spend has changed over recent months relative to the defined budget.
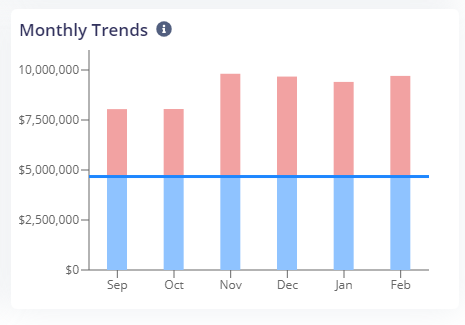
- This view helps evaluate longer-term spend behavior rather than short-term fluctuations.
- It can be used to assess whether budgets remain aligned with actual usage patterns or require adjustment based on sustained trends.
Monthly Trends are commonly used as a reference point during budget reviews and forecasting discussions.
Updated 6 months ago