MSP Dashboard
Explore how the Ternary MSP Dashboard supports centralized visibility into spend, anomalies, savings, integrations, and user access across child tenants.
The Ternary MSP Dashboard provides centralized visibility across all child tenants managed under an MSP parent tenant. Access to data is permission-based, allowing administrators and account owners to review cross-tenant activity without switching tenant context.
The dashboard is organized into five tabular views:
- Reporting: Aggregated cloud spend across all child tenants.
- Anomalies: Recent anomaly and threshold alerts surfaced by the tenants.
- Savings: Usage and rate-based savings opportunities across tenants.
- Integrations: Health and reporting status of cloud integrations across tenants.
- Users: User access and activity statistics across all configured tenants.
The Reporting tab in the Ternary MSP Dashboard
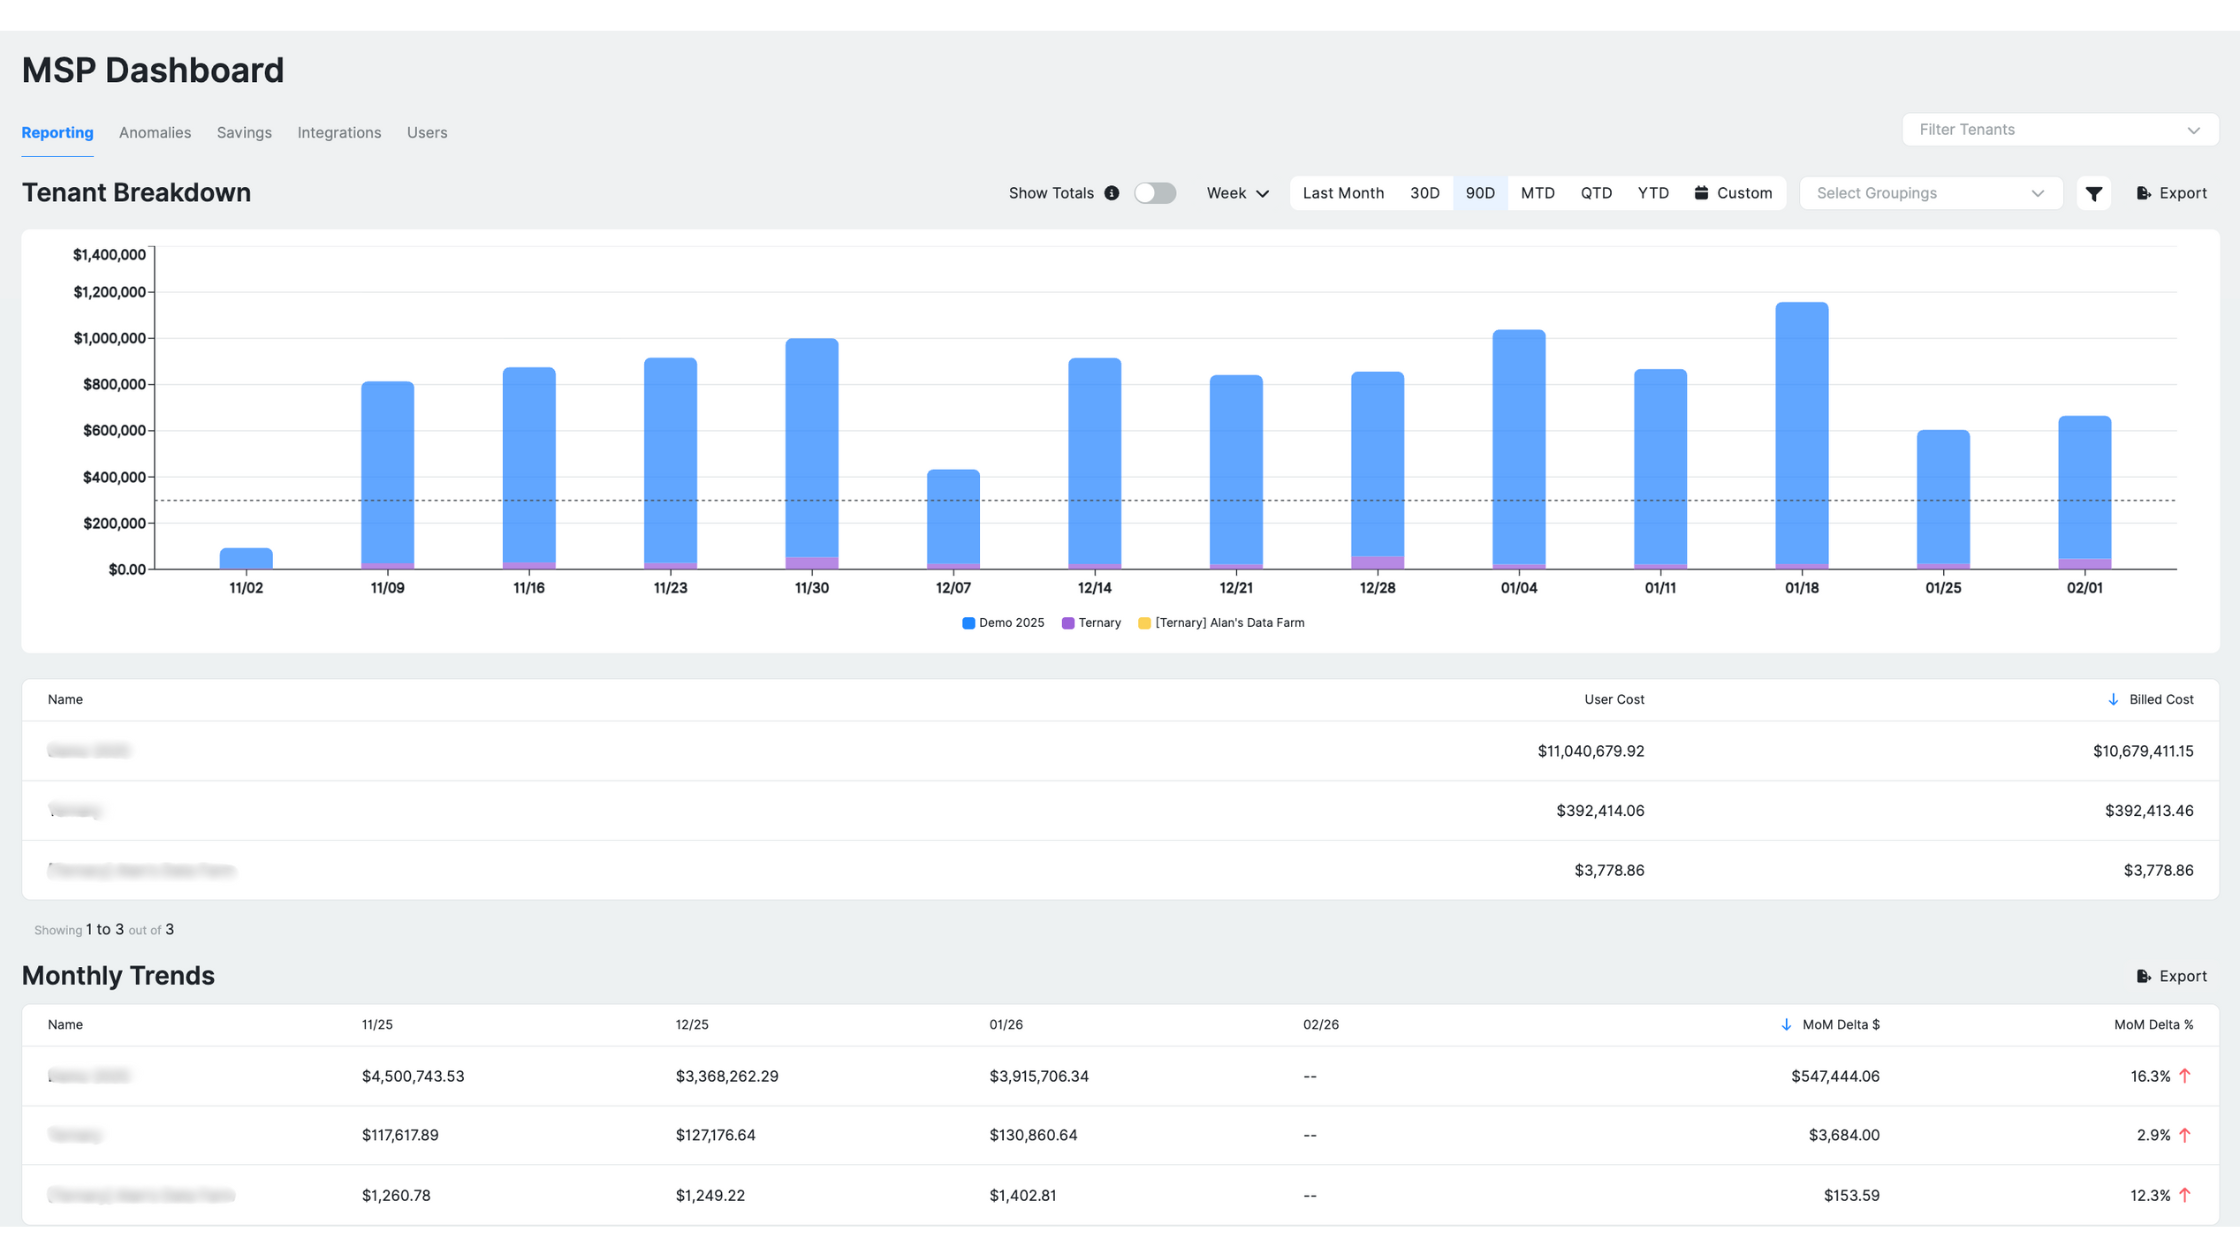
The Reporting view presents tenant-level cloud spend using both tabular data and trend visualizations. Spend can be reviewed across all child tenants in a single view.
Chart legends are interactive. Selecting a tenant in the legend hides or shows that tenant’s data, enabling focused analysis without modifying filters.
The Anomalies tab in the Ternary MSP Dashboard
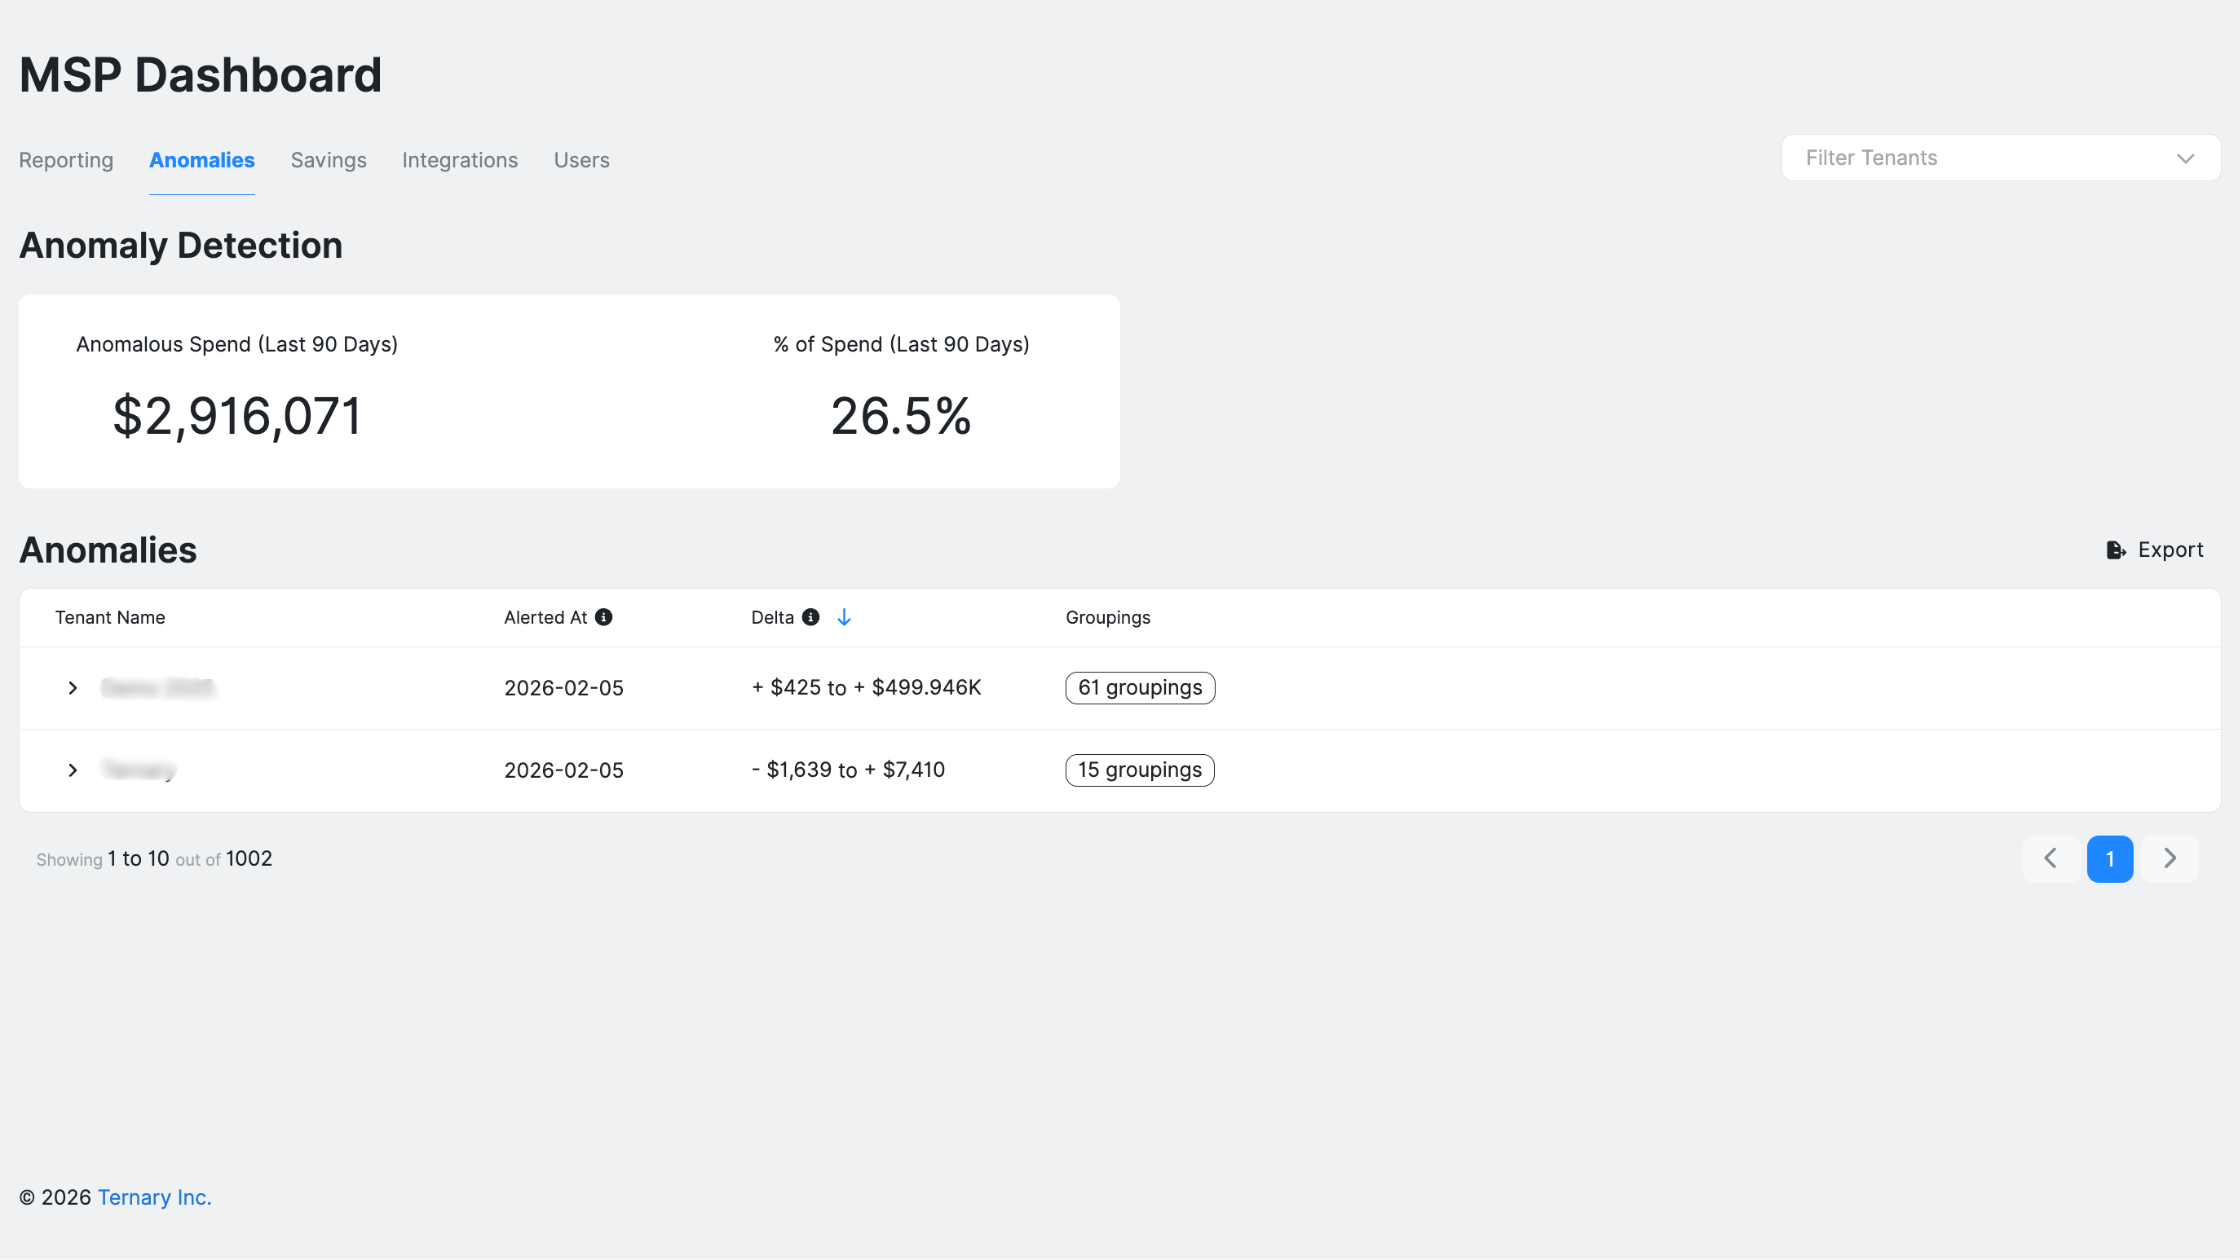
The Anomalies view displays a consolidated table of recent anomaly and threshold alerts across all child tenants. Alerts are grouped by tenant and can be sorted by timestamp or variance magnitude.
This view supports prioritization of investigation based on alert severity or recency.
The Savings tab in the Ternary MSP Dashboard
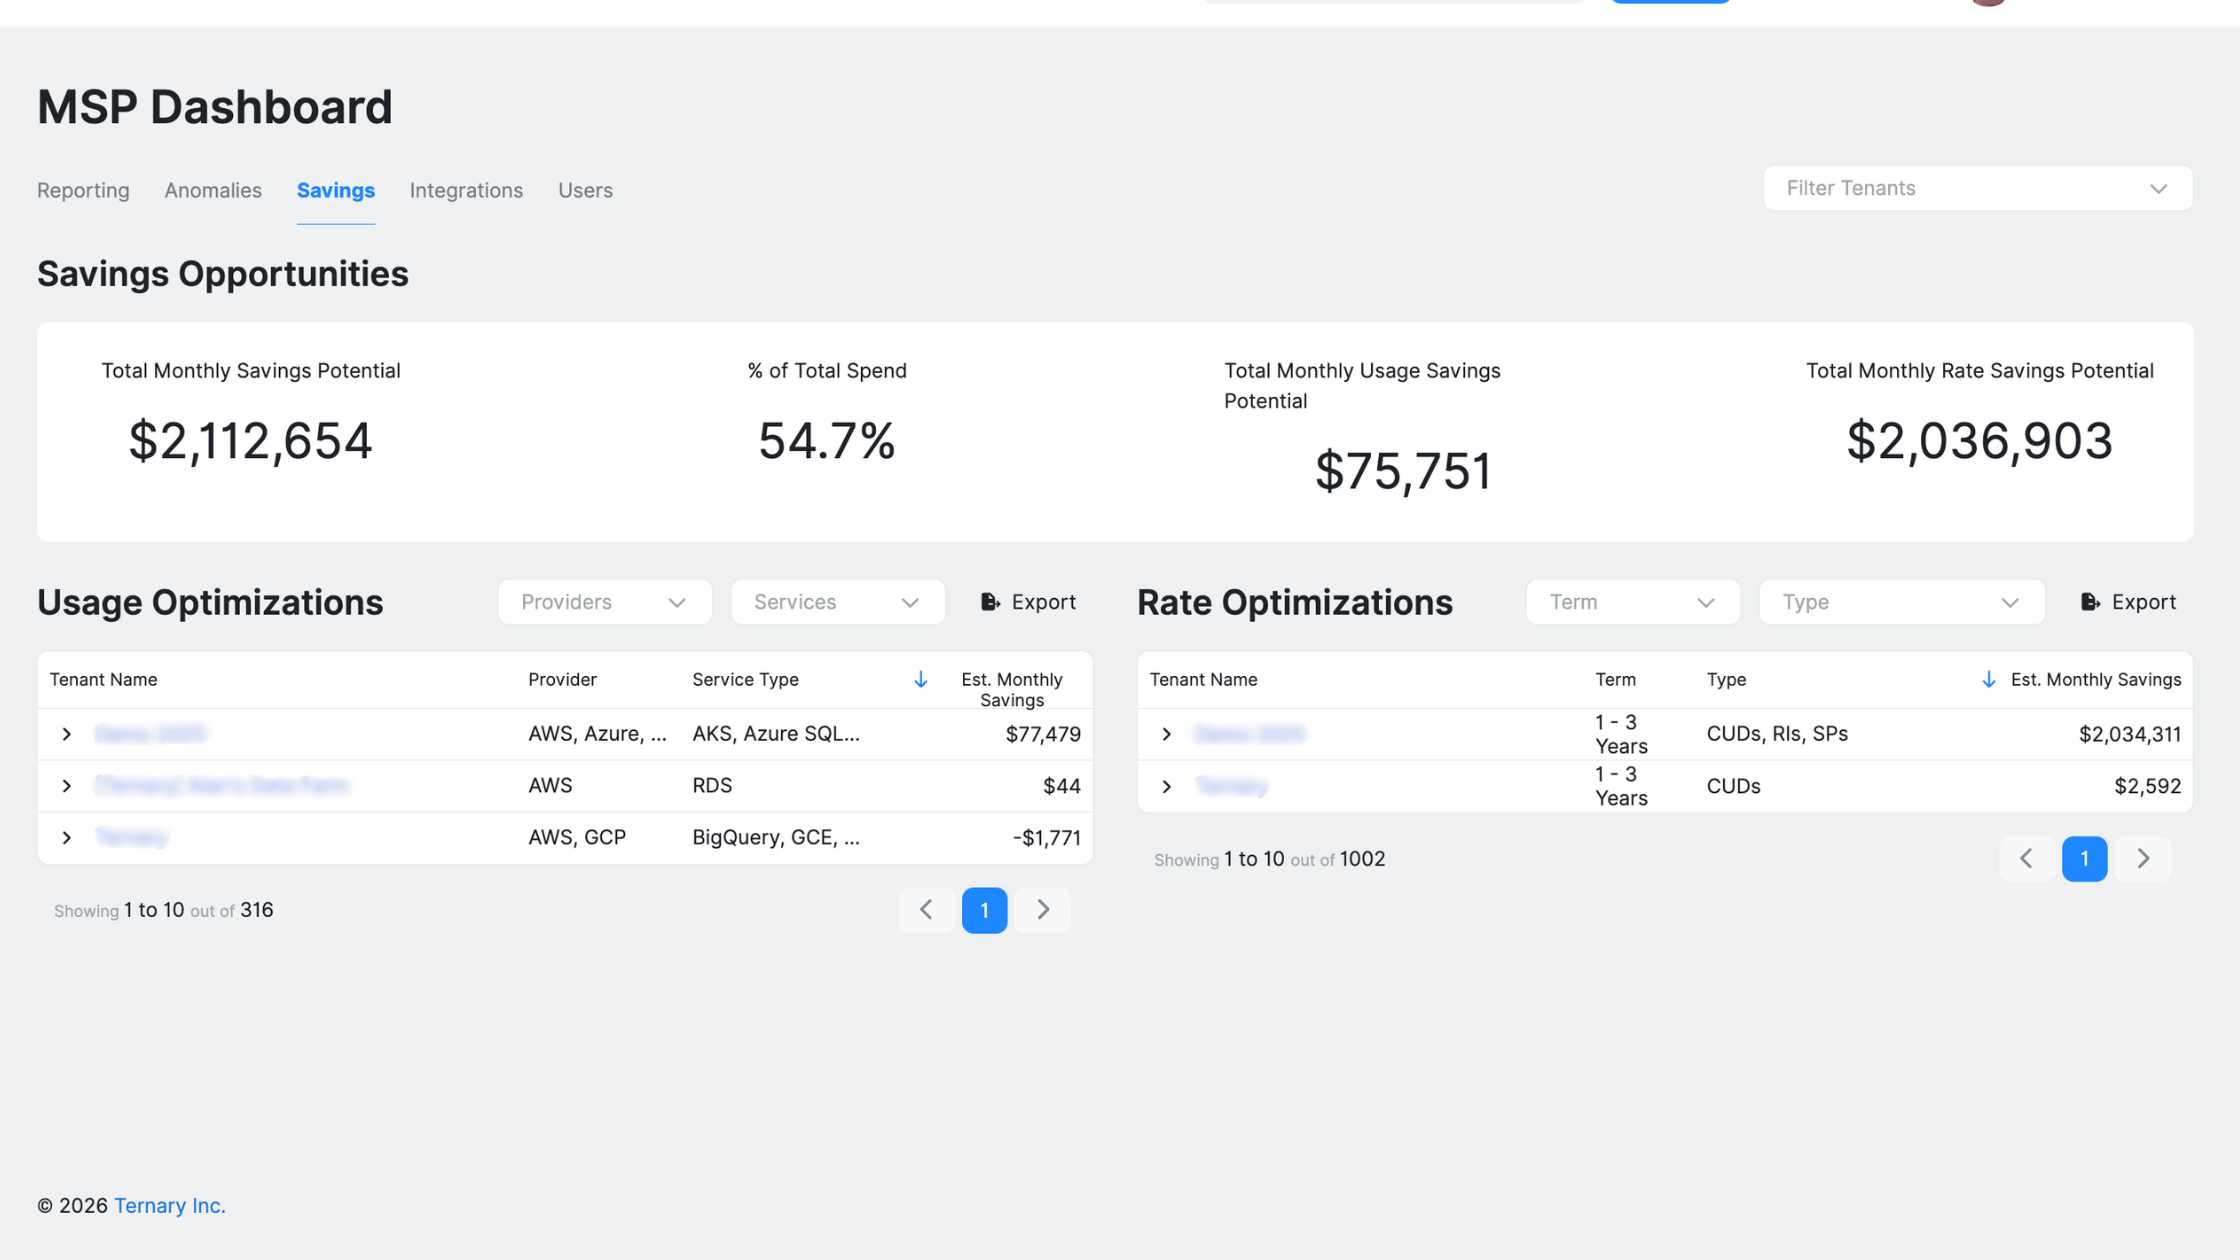
The Savings view aggregates usage and rate optimization opportunities across all tenants, categorized by tenant, service, and savings instrument type.
Table sorting enables identification of tenants or services with the highest potential impact, supporting prioritization during optimization reviews.
The Integrations tab in the Ternary MSP Dashboard
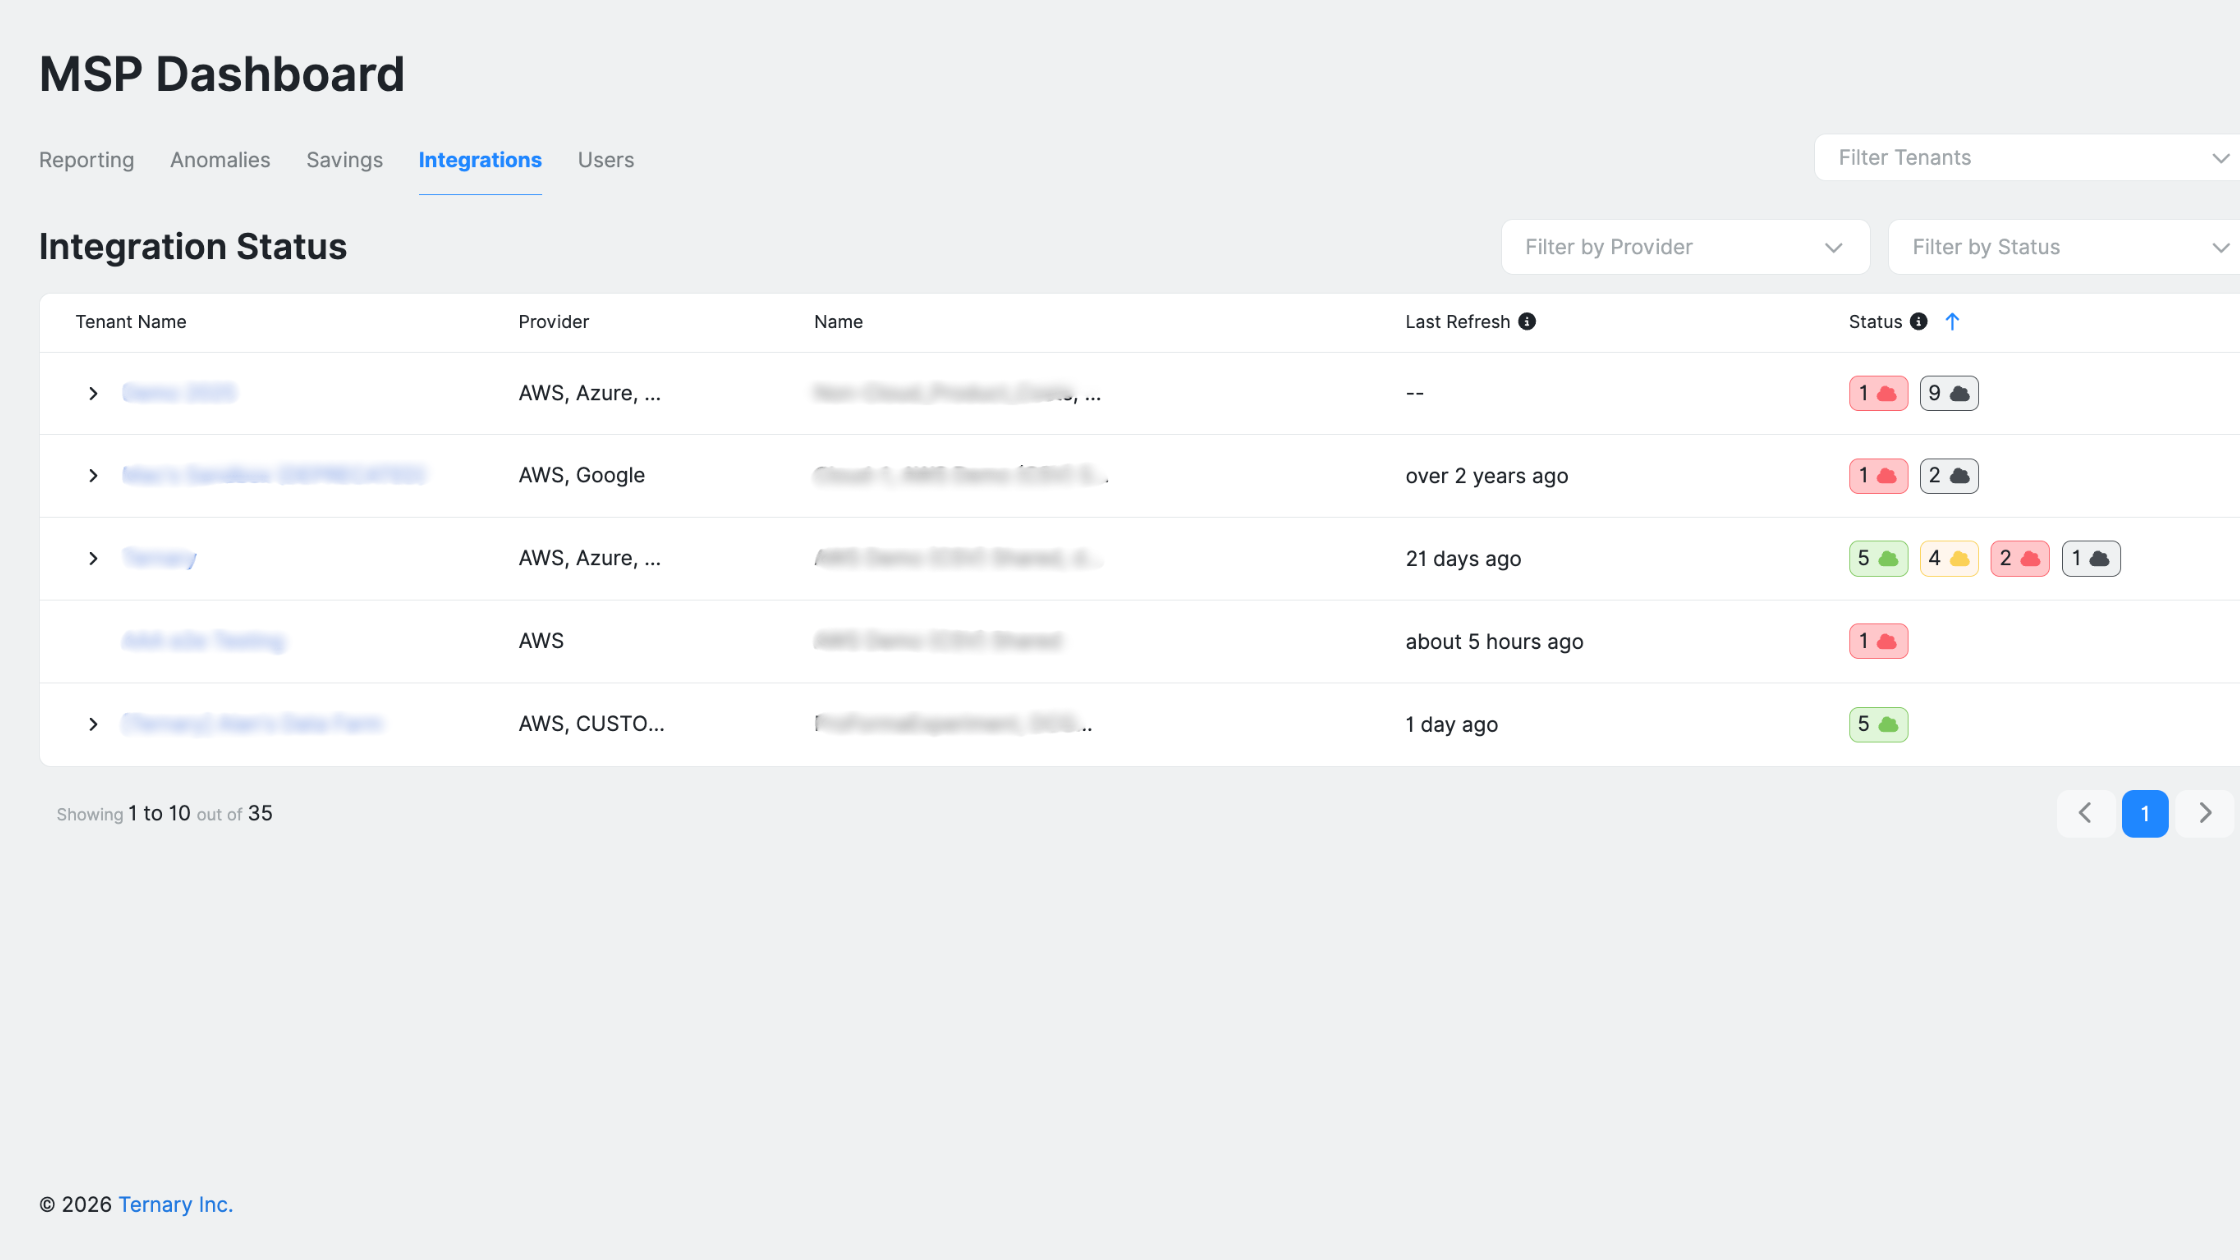
The Integrations view displays the status of all configured cloud integrations across child tenants. Each row includes tenant name, cloud provider, last reporting update, and current status.
Hovering over a status icon reveals additional context. Tables can be sorted and filtered to isolate integrations requiring attention.
With correct access roles, selecting a tenant name navigates directly to that tenant’s cloud configuration page. If access is restricted, the platform surfaces an access request flow. Returning to the dashboard restores the Integrations view.
The Users tab in the Ternary MSP Dashboard
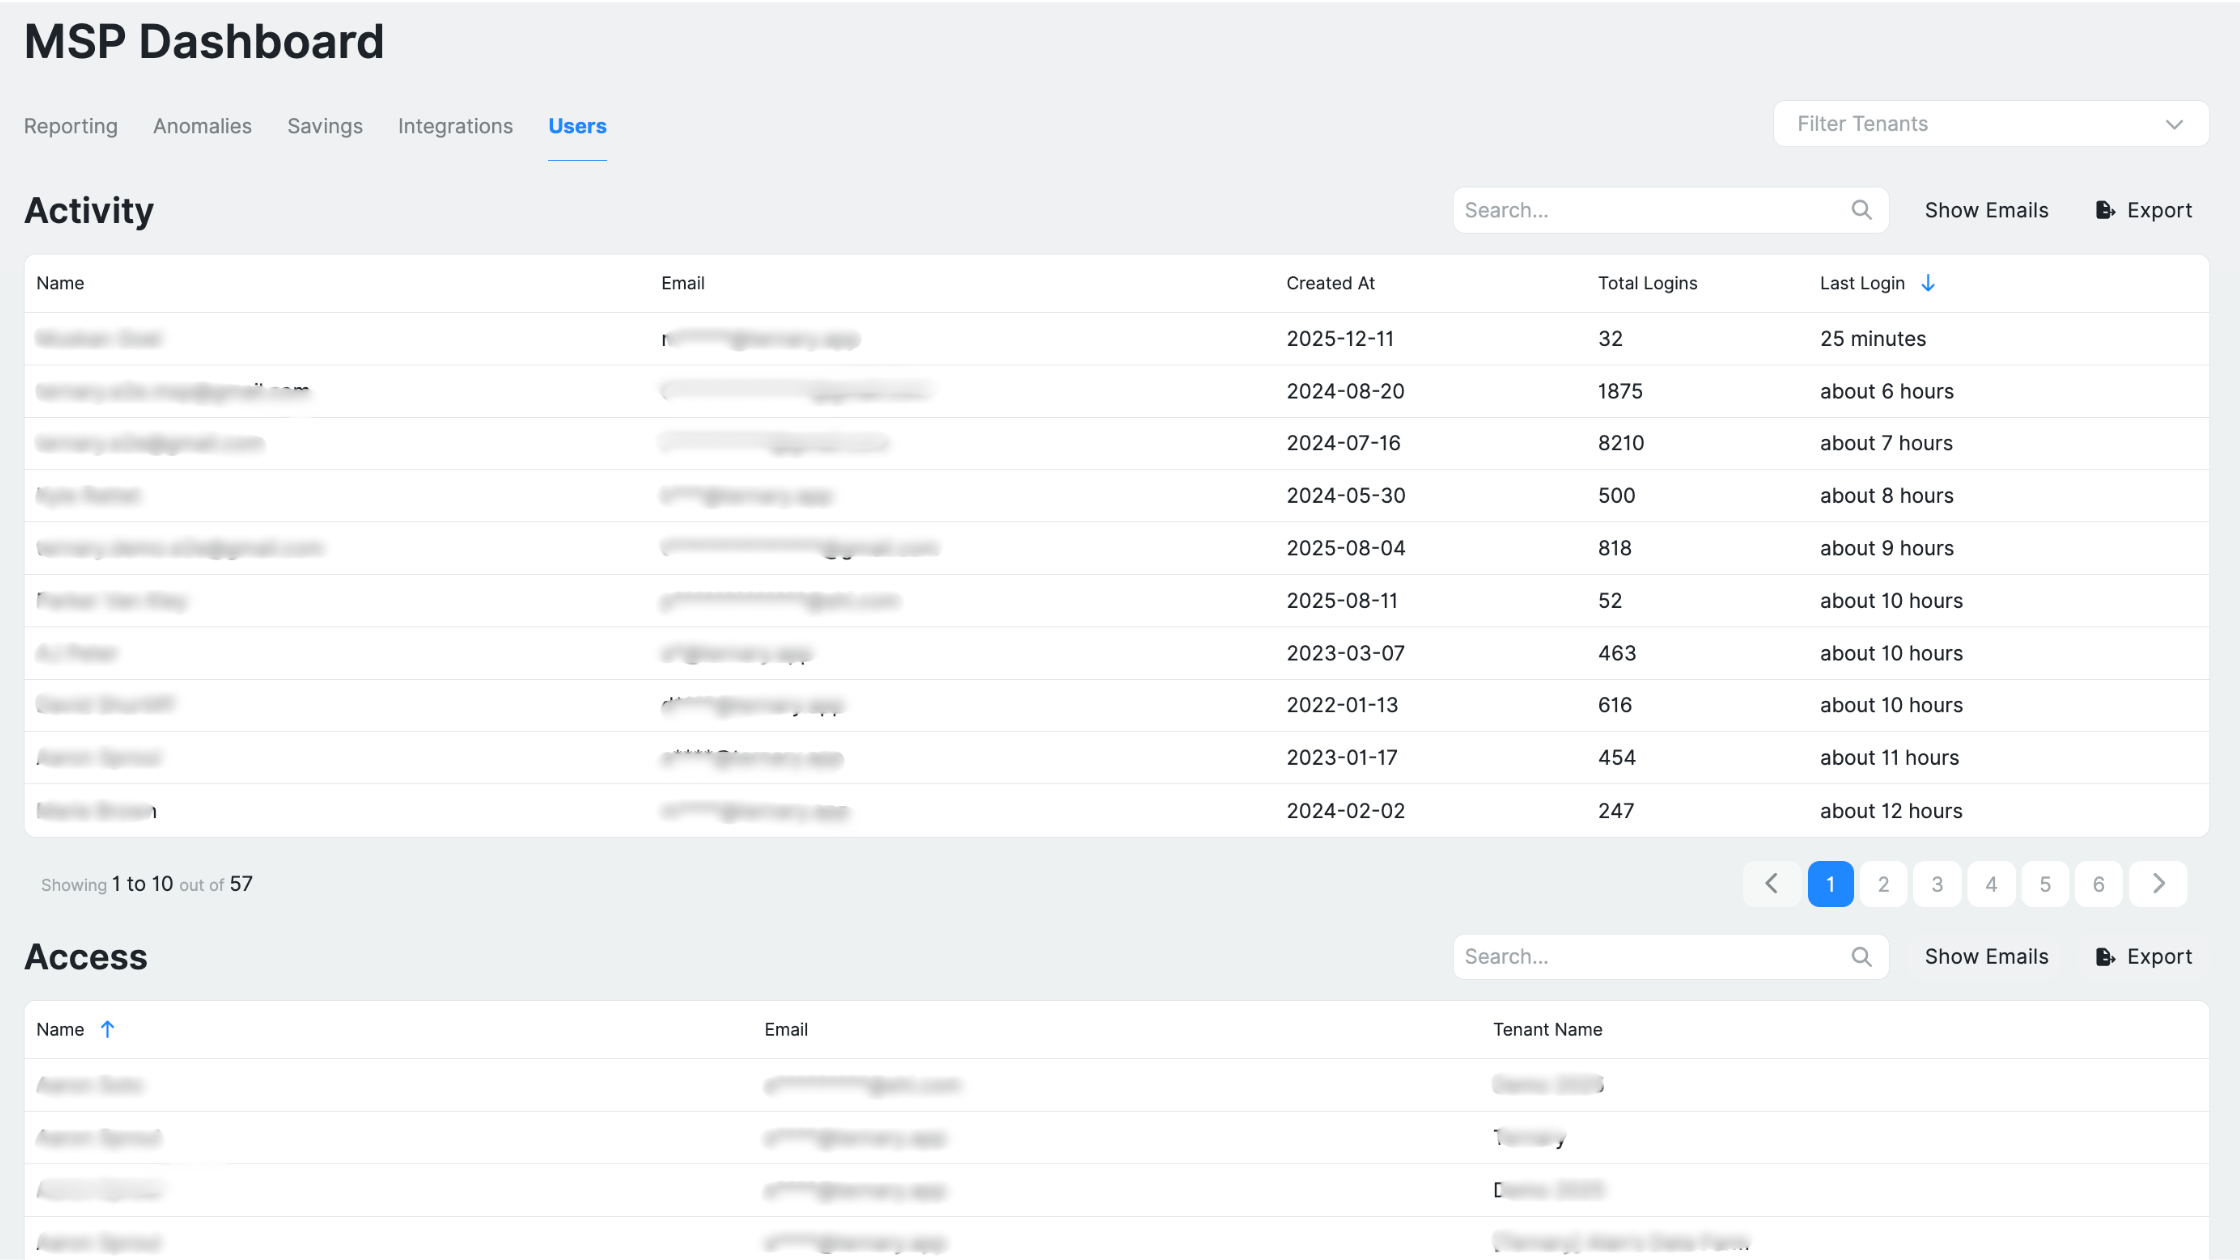
The Users view provides visibility into user activity and access across tenants. The upper table summarizes login frequency and session duration by user. The lower table maps user access across all child tenants.
Both tables support sorting and search-based filtering to quickly identify access patterns or inactive accounts.
Updated 6 months ago