Data Warehouse Insights
The Data Warehouse Insights pages support the following services:
- Amazon RedShift
- Google BigQuery
- Snowflake Virtual Warehouses
Google BigQuery
Prerequisites
- You will need the Project IDs, where BigQuery is running and you would like enhanced insights.
- You will also need the Usage Region where the BigQuery service is running.
- You will also need to have a Google Cloud connection currently configured in Ternary successfully ingesting cost and usage data. If you don't have this yet, check out Google Cloud Platform onboarding documentation.
If you have configured Enhanced BigQuery Monitoring ) and you are not seeing the Insight page populate there are a few things to check:
- If you configured it recently, please allow 24 hours for the insights page to populate
- If you selected the "In the folder containing this project" option when configuring the enhanced BQ monitoring and the project is not in a folder the data will not populate. Change the configuration to use the "In this project only" option.
- Double check the location is correct in the configuration. In the support article above, it details how to create a report to find the corresponding region/location of the BigQuery usage for the Project ID.
Guide
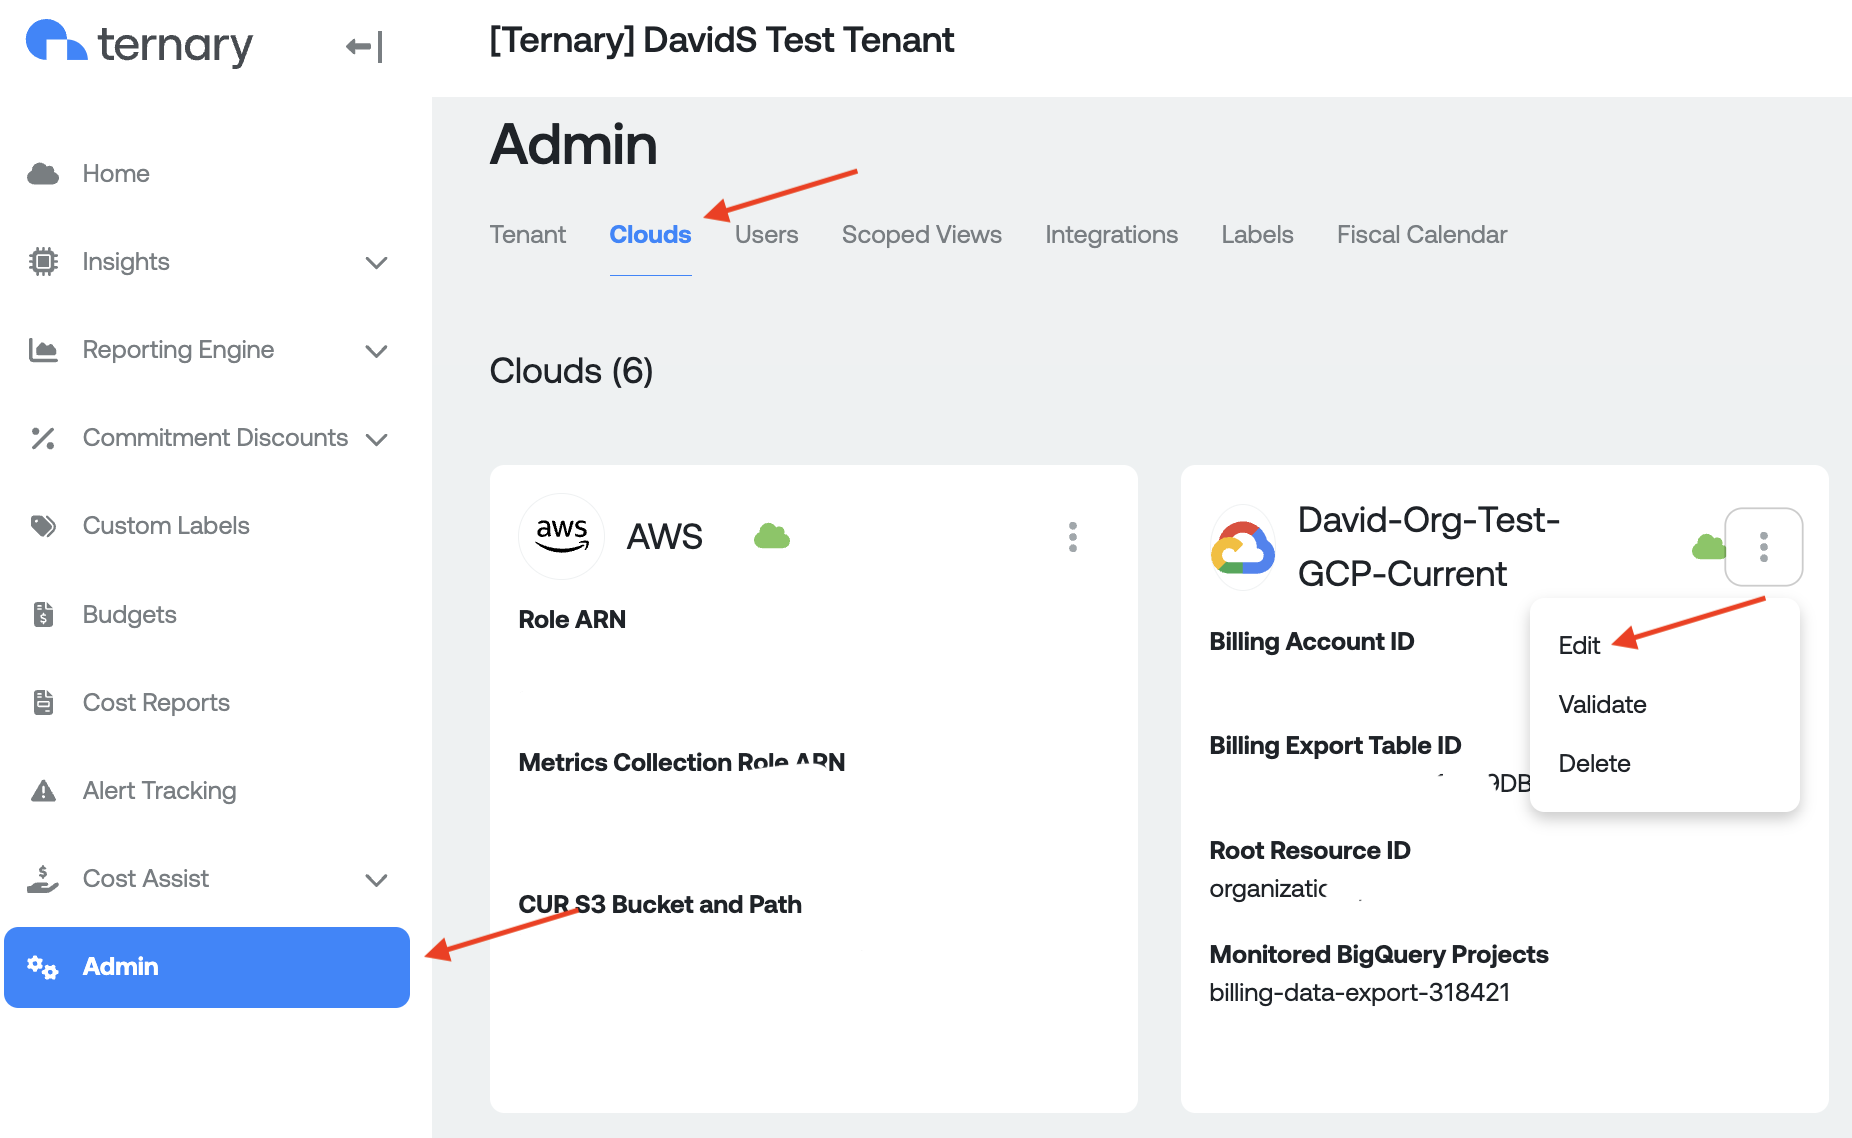
Navigate to the Admin page, locate the Google Cloud connection you want to add BigQuery support to and hit [...] followed byEdit. Then navigate to the BigQuery tab inside the configuration.
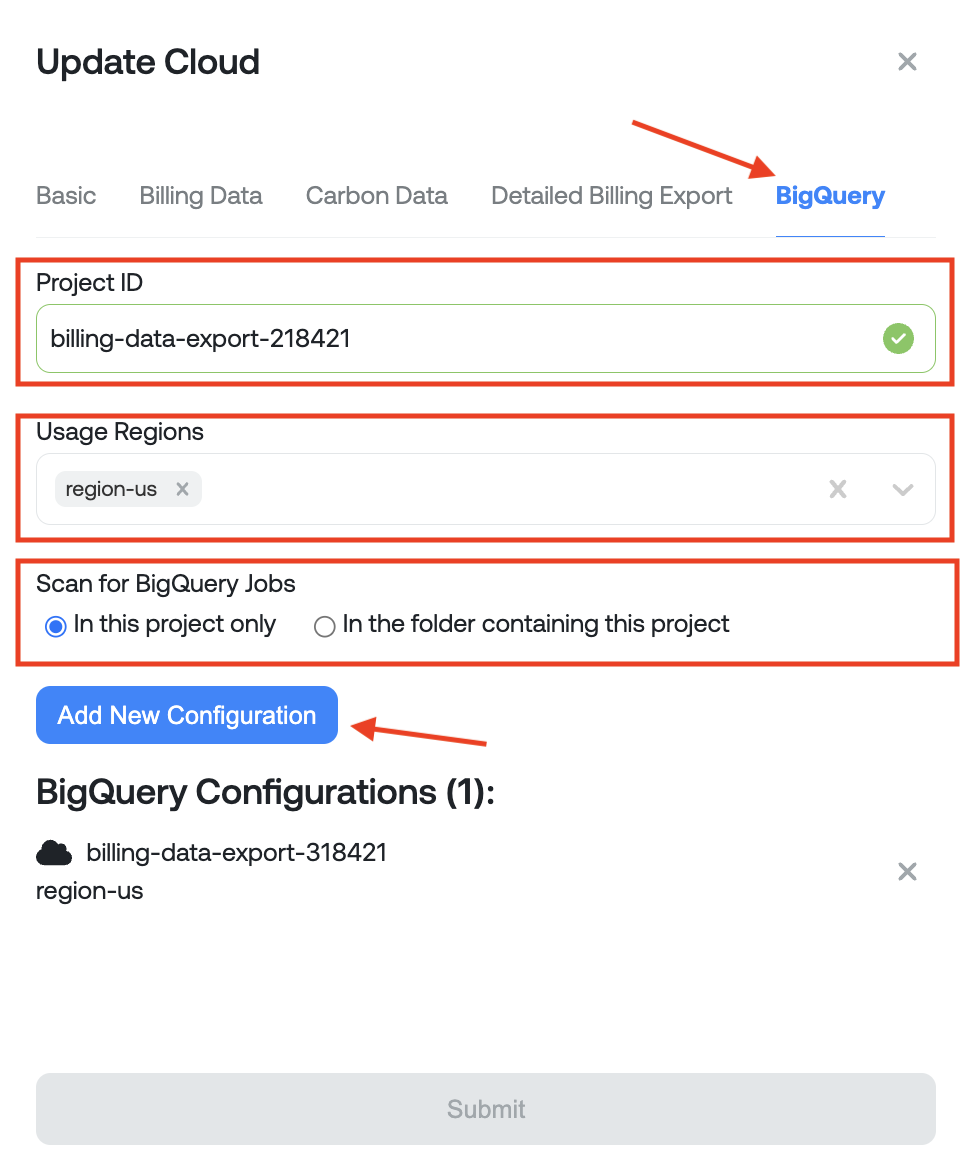
In the BigQuery tab, input the applicable Project ID and Usage Regions. Select the appropriate option in Scan for BigQuery Jobs depending on where your BigQuery jobs are located. If you use BigQuery in multiple projects within your Google Cloud organization, it is recommended to select "In the folder containing this project", and choose a project that is within a folder that contains all your other usage projects.
When you are finished inputting the data, click Add New Configuration before clicking save. It's possible to have multiple configurations, in the case where you need to monitor multiple individual projects. In that case, repeat the steps but with a different project ID and set of regions.
When done supplying configurations, you can press Submit to finish. If Ternary is unable to connect to those projects or folders, you will see a corresponding error in the Monitored BigQuery Projects section of the cloud configuration. If you hover over the triangle with an exclamation point an error message will be surfaced. Error messaging is descriptive but if you need assistance please open a support ticket or reach out to your Ternary Customer Success Manager. Please note, upon successful validation, it may take up to 24-hours to populate the Data Warehouse - Insights - BigQuery page.
Data Warehouse Insights
The BigQuery tool in Ternary is to allow you to get visibility into your on-demand BigQuery usage.
Flex Slot usage visibility and reservations, Flat Rate usage visibility and reservations and general recommendations for BigQuery are slated for our next release.
Ternary aims to identify potential problem areas in your BQ spend, so that you can start having conversations with your engineering, product and data science teams on ways to optimize costs.
Total Cost:
On-demand billing is based on bytes read, the larger the dataset that you’re reading and the output that you seek, the more it will cost.
The standard rate for BQ is $5/TB read.
Note: Within Ternary, we calculate total cost by taking the number of bytes read and applying the standard price to it. Your organization's on-demand price might differ if you’ve negotiated rates with GCP. (Support for custom pricing to ensure accurate representation of cost is coming soon).
Job Count
This is the number of jobs running in your environment (the number of times a query is executed). This number could indicate that you have few queries running multiple times or multiple queries running a few times for example.
Why is Job Count meaningful?
In an extreme example, let’s say you have 1 query/job in a table that spends the most money. In that case it might be worth looking into to see why one query would cost so much money. First thing you would want to ask is, is this query essential? Secondly, have we done the appropriate checks to make sure this query is optimized: ie making sure there are no * statements, usage of streaming inserts etc.
In the opposite extreme case, if you have a disproportionate amount of jobs driving up usage in a table or dataset, it could be worth investigating if it’s the same type of query or same query driving up your job count. Maybe someone set up a query to run automatically every 15 minutes in perpetuity
Avg. Duration:
This measures the average amount of time it took to execute a query.
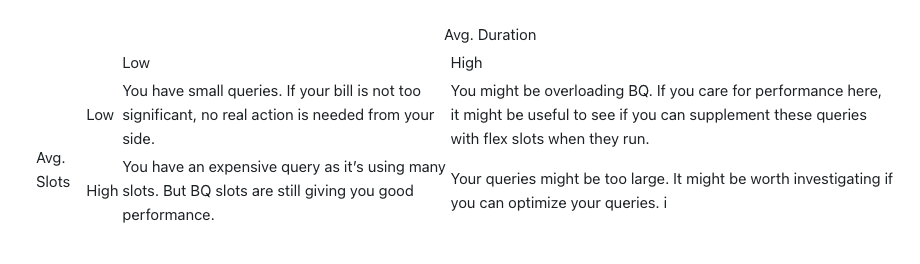
Avg. Slots:
Slot seconds is a proxy to give you a sense of how many slots you’re using. In general, the more slots seconds you use means the more experience your queries are.
To get meaningful insight into what you can do with this data, it’s important to look at Avg. slots and Avg. duration in tandem:
Summary View
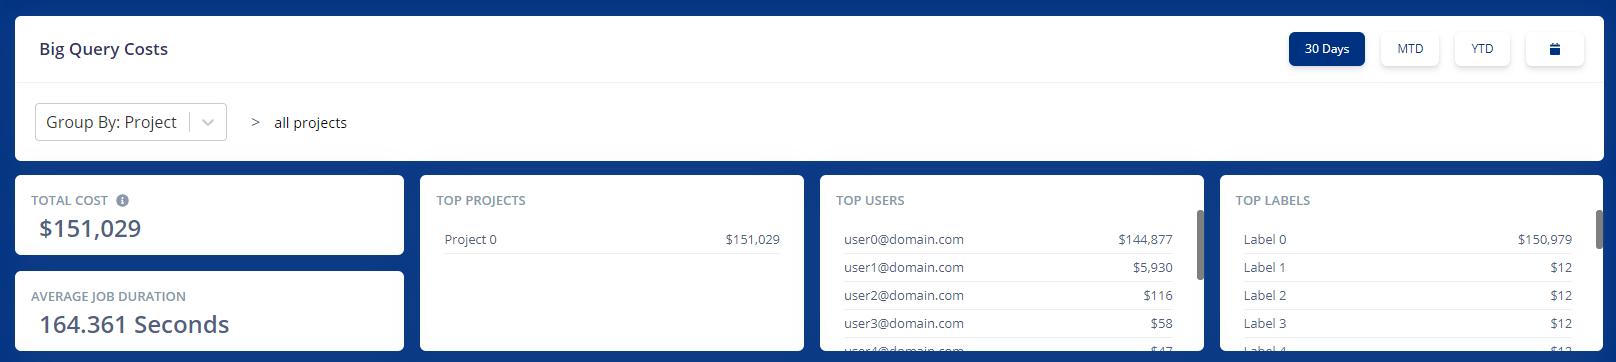
The summary view gives you a view of your total spend, and which project, table, or user your spend is coming from. The goal is to give you a high level summary of the state of your BQ usage to give you direction on where you need to explore next.
The BQ Uber Graph
Aggregation Categories
You can aggregate the data using the Group By section by:
- Projects
- Users
- Labels
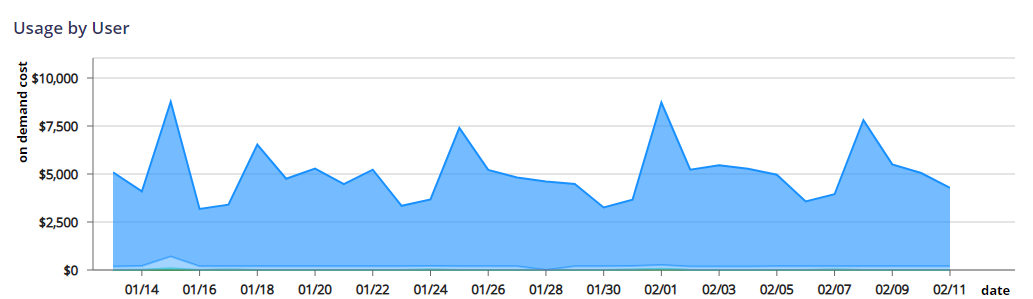
In the example above, I’ve selected users as the aggregation category. If you want to go back to a higher level of aggregation click on the breadcrumbs for all users and you will go to the highest level of aggregation.
How the Graph Works:
The graph let’s you click on any element to drill down further. The first snapshot that you see on the page will group data by the group by filter you applied above.
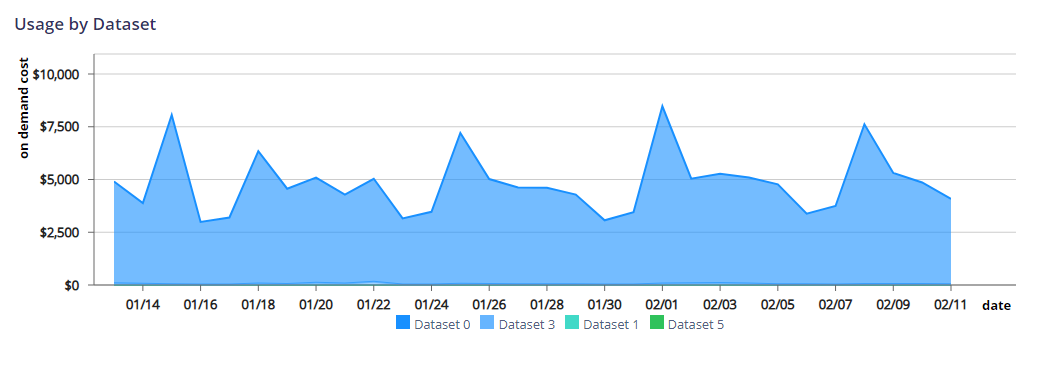
In general, the hierarchy is as follows:
- Projects → Dataset --> Table
- Users --> Dataset --> Table
- Labels → Dataset → Table
Default View
Drill Down 1 (Dataset)
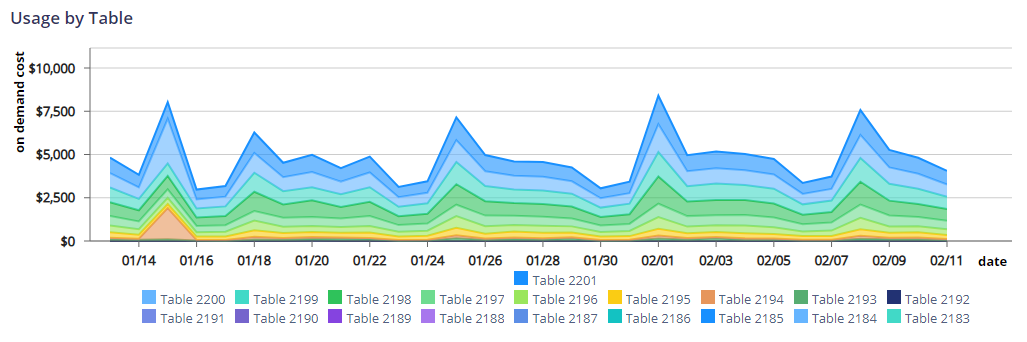
Drill Down 2 (By Table)
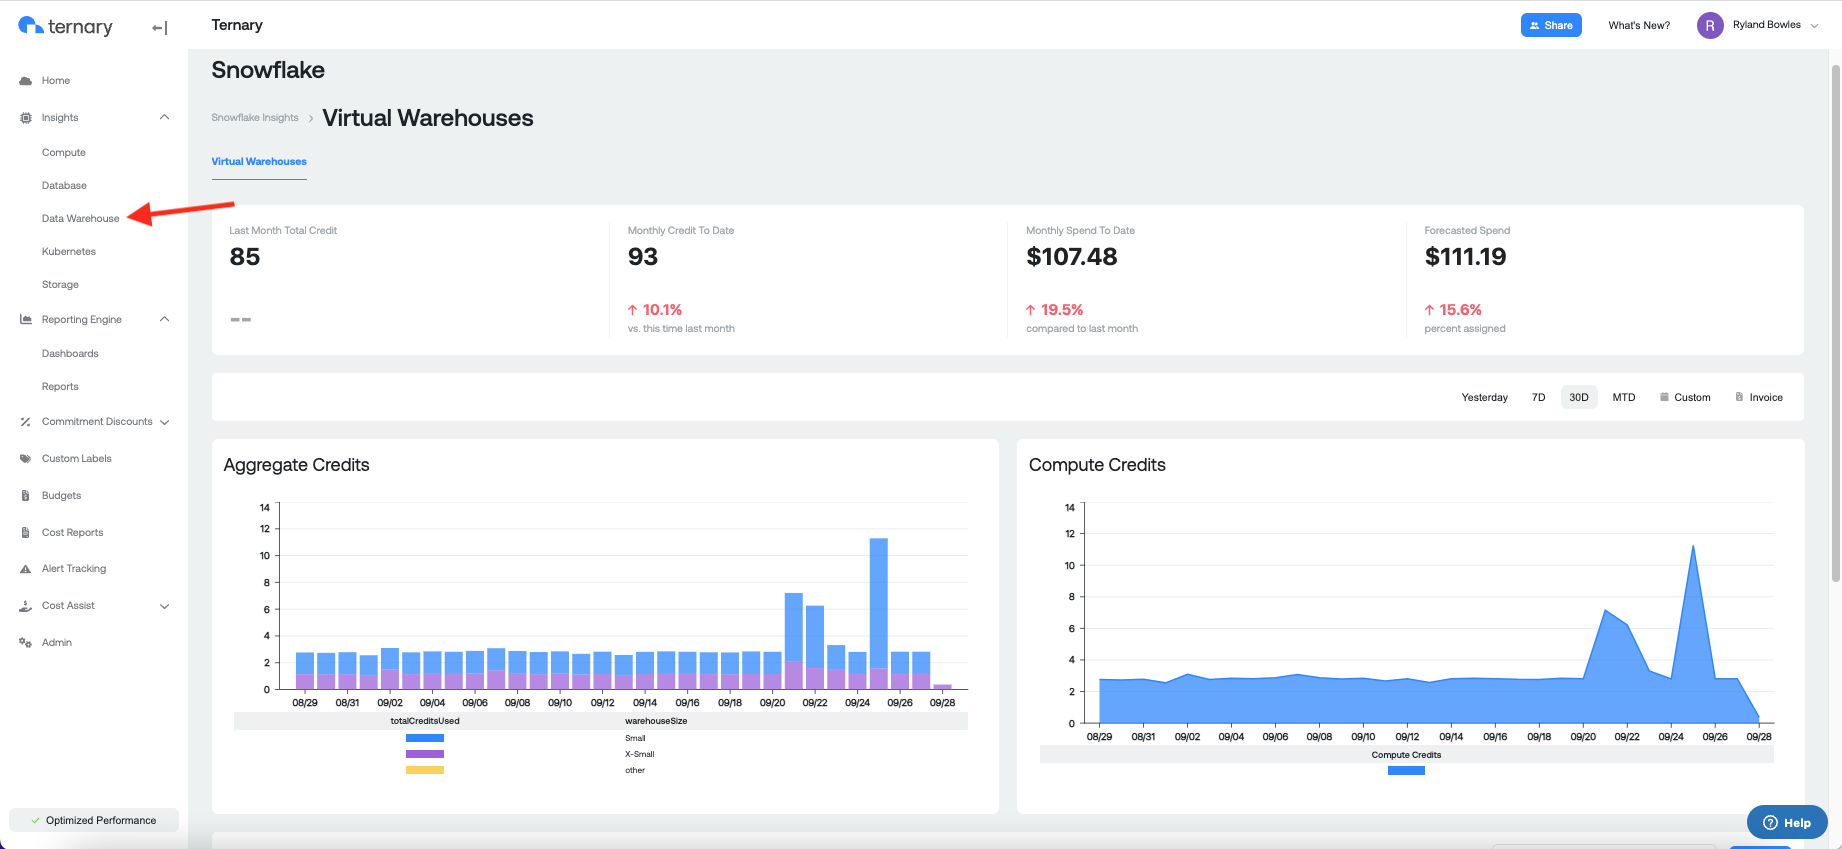
Snowflake
Prerequisites
To view your organizations Snowflake data in Ternary you must set up ingestion of your Snowflake data on the Admin page in Ternary. Documentation, for doing so, is located here: https://docs.ternary.app/docs/snowflake
Snowflake Insights Page:
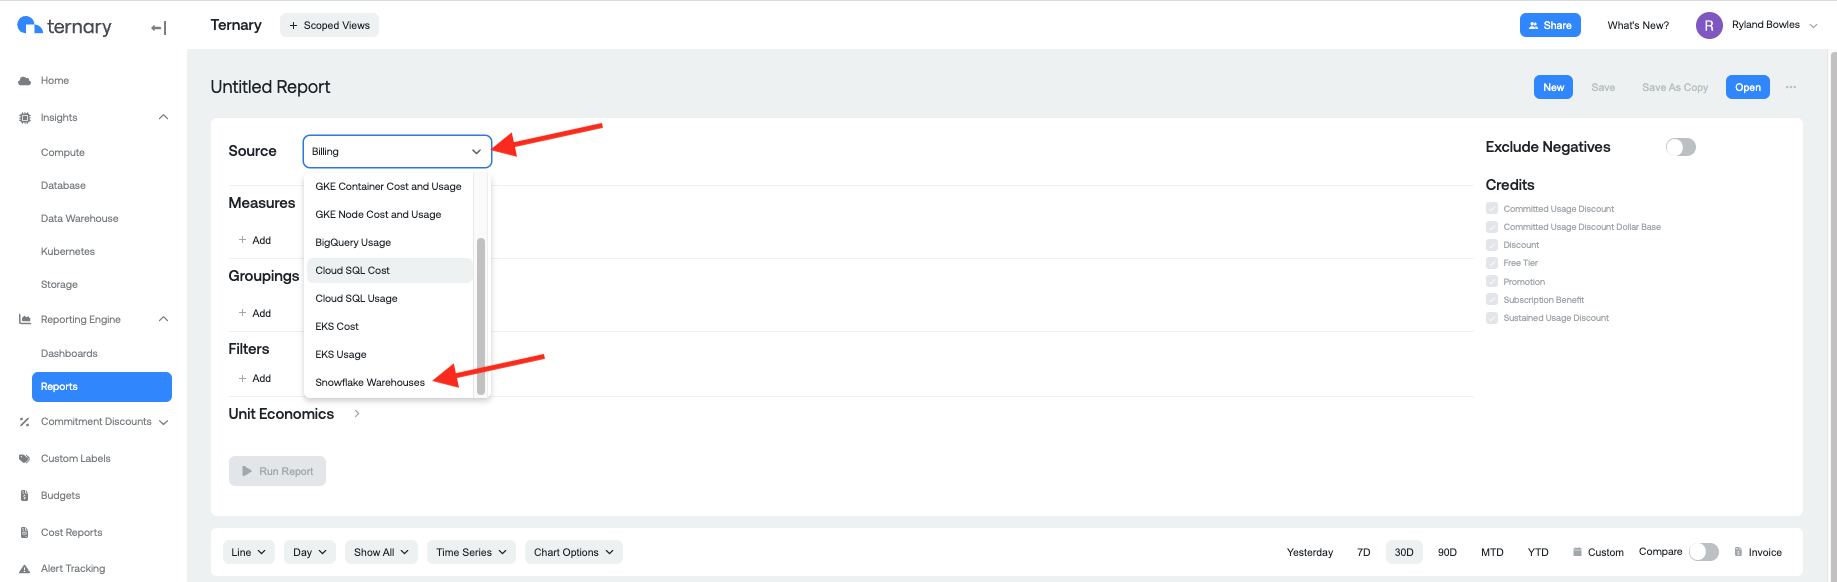
Using Ternary Reporting Engine to analyze Snowflake cost and usage data:
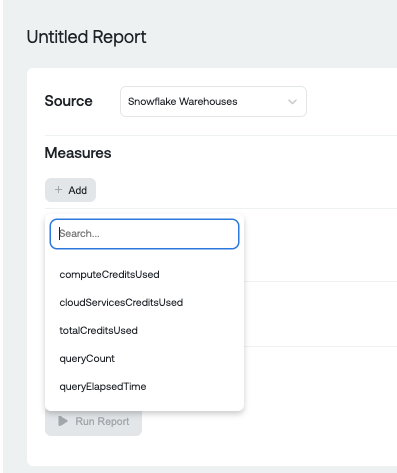
Snowflake Measures:
Snowflake Groupings:
Updated 2 months ago