Compute Insights
The Compute Insights pages support the following services:
- Amazon Elastic Compute Cloud (EC2)
- Azure Virtual Machines (VMs)
- Google Compute Engine
- Gogle Cloud Run
Visibility
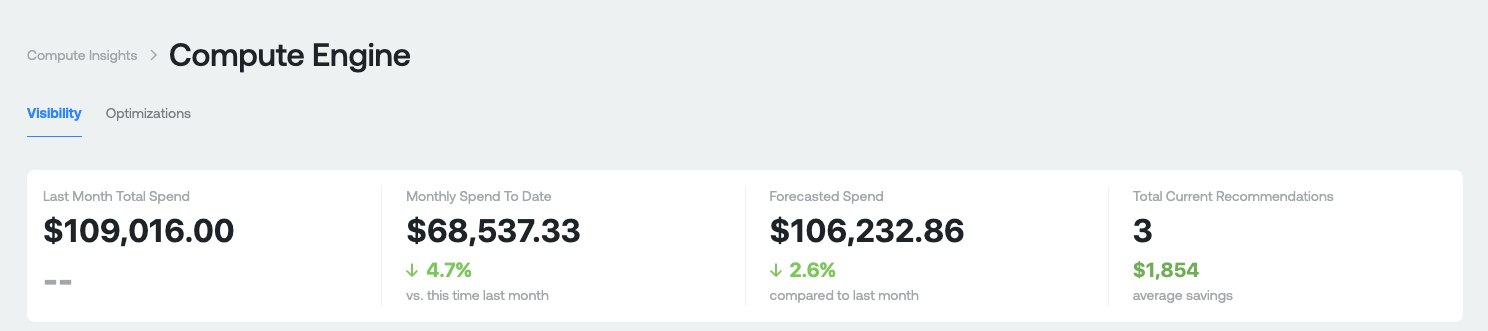
Purpose: This section is designed to give you a high level overview of what you're spending on compute today, how much money you could theoretically save, and the number of recommendations that you could potentially work on.
Measures:
- Last Month Total Spend: This your total Compute spend last month. This is gross cost and does not include any discounts you receive.
- Monthly Spend to Date: This is your total Compute spend month-to-date for the current month. The percentage represents the difference between your current month-to-date spend compared last months-to-date spend. This is gross cost and does not include any discounts you receive.
- Forecasted Spend: This is a projection of your total Compute spend by the end of the current month. The percentage represents what your projected spend will be this month compared to last month.
- Total Current Recommendations (for Google services): Number of rightsizing recommendations available for savings. The average savings is the total of all savings of each recommendation / # of recommendations available.
Cost and Usage Graphs
Aggregate Costs Graph
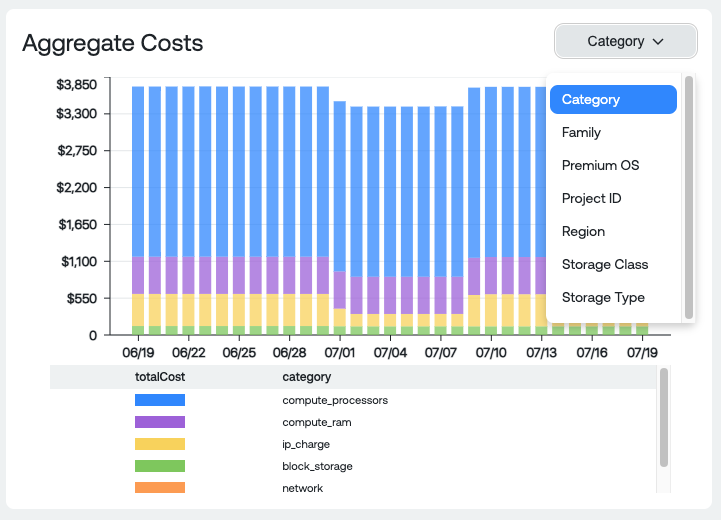
Dimension Groupings:
- Category: High level categories of Compute spend such as Cores, RAM, Block Storage, Network, Load Balancing, etc
- Family: The machine family
- Premium OS: Any premium OS licensing cost (Debian, Container optimized OS from Google, etc)
- Project ID: Compute spend per Project/Account/Subscription
- Region: Compute spend per Region
- Storage Class: The Compute storage class
- Storage Type: Type of storage associated with Compute
Usage Graph
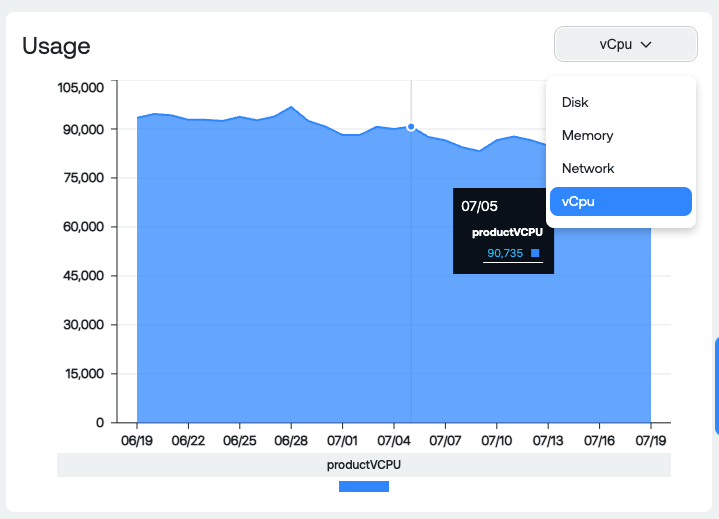
Dimension Groupings:
- vCPU: Total number of vCPU for all Compute VMs
- Memory: Total RAM for all Compute VMs
- Network: Total Received and Sent bytes for all Compute VMs
- Disk: Total Read and Write bytes for all Compute VMs
Instance and Family Table
Please note, if you do not have the GCP detailed billing export enabled and configured in Ternary you will not be able to use the View Instances option when viewing this on the Compute Engine specific page. If you'd like to enable it, please follow the onboarding guide located at: <https://docs-staging.ternary.app/docs/google-cloud-platform>
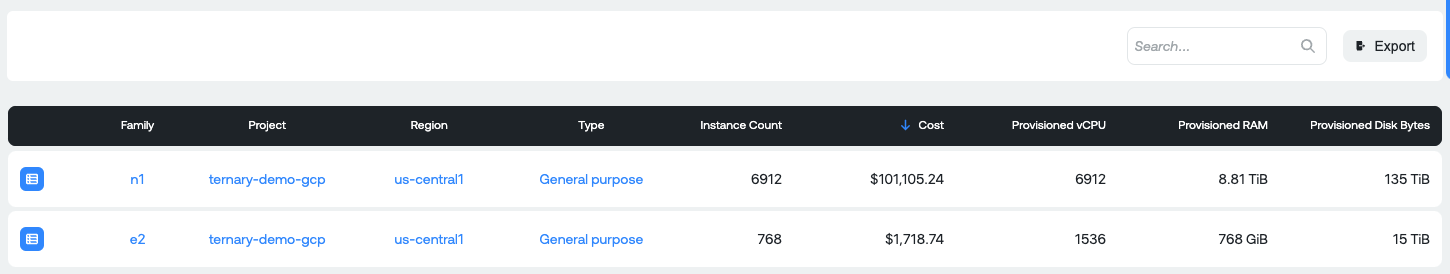
Measures:
- Family: The machine family of instances that cost and provisioning data is grouped into.
- Project: The project/account/subscription of the Compute cost and provisioning data.
- Type: The type of machine (General Purpose, Compute Optimized, Storage Optimized, Network Optimized, etc)
- Instance Count: The total number of Compute instances during the selected time period within the corresponding Family, Project and Type.
- Cost: The total cost, without discounts, for Compute spend within the corresponding Family, Project and Type.
- Provisioned vCPU: The total number of provisioned vCPU for all instances in Compute within the corresponding Family, Project and Type.
- Provisioned RAM: The total amount of RAM provisioned for all instances in Compute within the corresponding Family, Project and Type.
- Provisioned Disk Bytes: The total amount of Disk bytes provisioned for all instances in Compute within the corresponding Family, Project and Type.
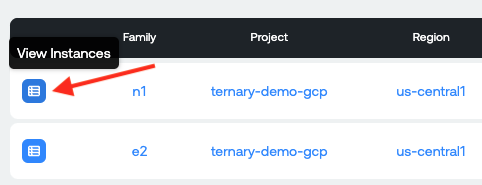
View Instances Report
Compute Engine Example:
Amazon Elastic Compute Cloud Example:
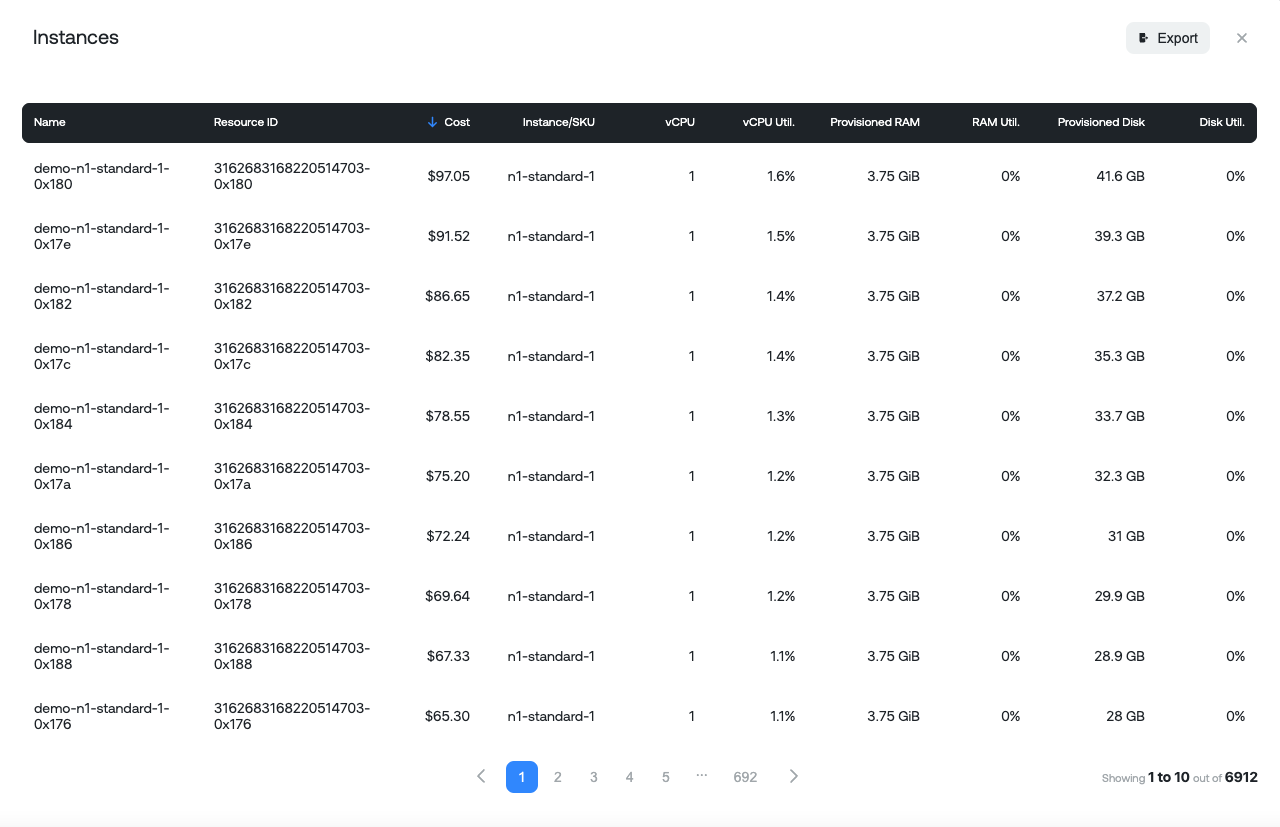
View Instances table
Measures:
- Name: The name of the Compute Instance
- Resource ID: Unique resource ID identifier of the Compute Instance
- Cost: Total cost for that instance over time period selected
- Instance SKU: Type of instance
- vCPU: Total vCPU associated with the unique instance
- vCPU util: Average CPU utilization
- Provisioned RAM: Total RAM associated with the unique instance
- RAM util: Average RAM utilization
- Provisioned Disk: Total GB/TB of storage associated with the unique instance
- Disk util: Average disk utilization (Reads/Writes)
Optimizations
Before diving into what the recommendation insights numbers are, it is important to know the different types of recommendations that are potentially surfaced in Ternary for Compute services in AWS, Azure, and GCP:
Amazon Elastic Compute Cloud (EC2) recommendations:
- VM Rightsizing: The CPU and memory utilization detected on this compute instance is consistently lower or higher than the recommended optimal utilization. Consider changing the instance type to one that is better suited for this workload.
- VM Termination: The VM in question is idle or not serving a discernable purpose. Please verify the VM is indeed unused and any data/state is recoverable or unneeded before terminating.
Azure Virtual Machine recommendations:
- Use Ephemeral OS Disk if your workloads are stateless: If your virtual machine workload is stateless and does not depend on storing information on the OS disk and using it after VM restarts, you can use an ephemeral OS disk instead of a regular Azure disk. Ephemeral OS disks are provided free of charge by Azure.
- VM Rightsizing: The CPU and memory utilization detected on this compute instance is consistently lower than the total capacity of the compute instance. Consider changing the instance type to one that is better suited for this workload, and remember that changing the instance 'class'(e.g. going from B2 to D3) might give you a CPU to memory ratio that is more suited to your needs.
- Rightsize Virtual Machine Scale Set: The aggregate CPU and memory utilization detected on this scale set is consistently lower than the total capacity of the entire scale set. Consider adjusting the scale set instance type or the size of individual instances to save money.
- Unattached Storage: This disk is not attached to a virtual machine. You are billed for disks whether or not they are used by a virtual machine, and sometimes they won't be deleted automatically when you delete an underlying compute instance.
- Consider standard storage for storing snapshots: You are using the Premium SSD storage type for storing your disk snapshots. If you don't need the performance of Premium SSD, consider Standard HDD, as well as choosing lower storage redundancy, to reduce the ongoing cost of maintaining a snapshot.
Google Compute Engine recommendations:
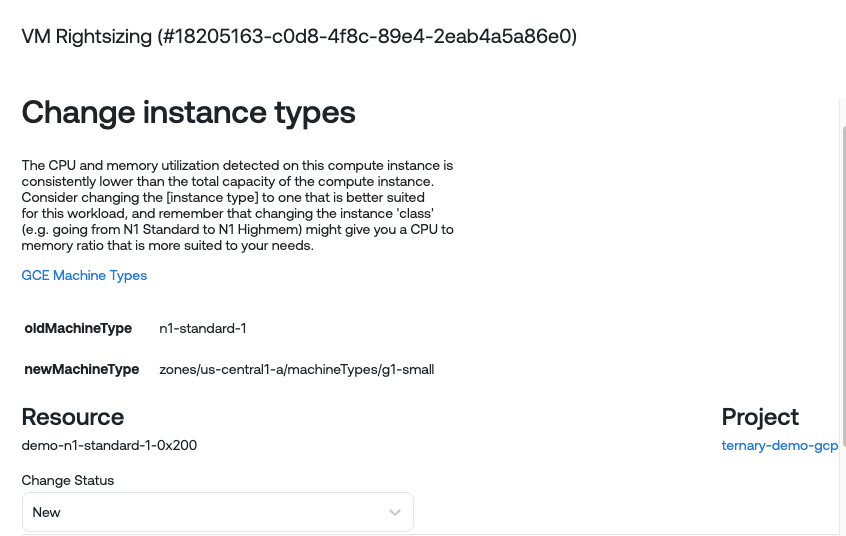
- VM Rightsizing: The CPU and memory utilization detected on this compute instance is consistently lower than the total capacity of the compute instance. Consider changing the [instance type] to one that is better suited for this workload, and remember that changing the instance 'class' (e.g. going from N1 Standard to N1 Highmem) might give you a CPU to memory ratio that is more suited to your needs.
- Commitment Nearing Expiration: A compute commitment is nearing expiration. Review your commitments and your business context to determine if it should be renewed.
- Rightsize Instance Group: The aggregate CPU and memory utilization detected on this instance group is consistently lower than the total capacity of the entire group. Consider adjusting the instance group type or the size of individual instances to save money.
- Unused Static IP Address: There are one or more provisioned static IP addresses that are not in use. Delete the addresses that you do not plan to use, and make use of the ones you would like to keep.
- Zombie Resource: The amount of CPU being used by this compute instance is so close to zero that it is most likely not doing anything at all. Check that it is being accessed and is still useful to your applications, and remove it if it is not doing anything.
- Commitment Usage Drop off: The amount of CUD credits applying to a project has suddenly dropped. Review your compute instance types and commitments to verify this change is intended.
- Unattached Storage: This disk is not attached to a compute instance. You are billed for disks whether or not they are used by a compute instance, and sometimes they won't be deleted automatically when you delete an underlying compute instance.
Google Cloud Run recommendations:
- Switch to CPU Always Allocated: Based on the traffic to your Cloud Run service it is recommended that you switch from "CPU allocated during requests to "CPU always allocated".
Measures:
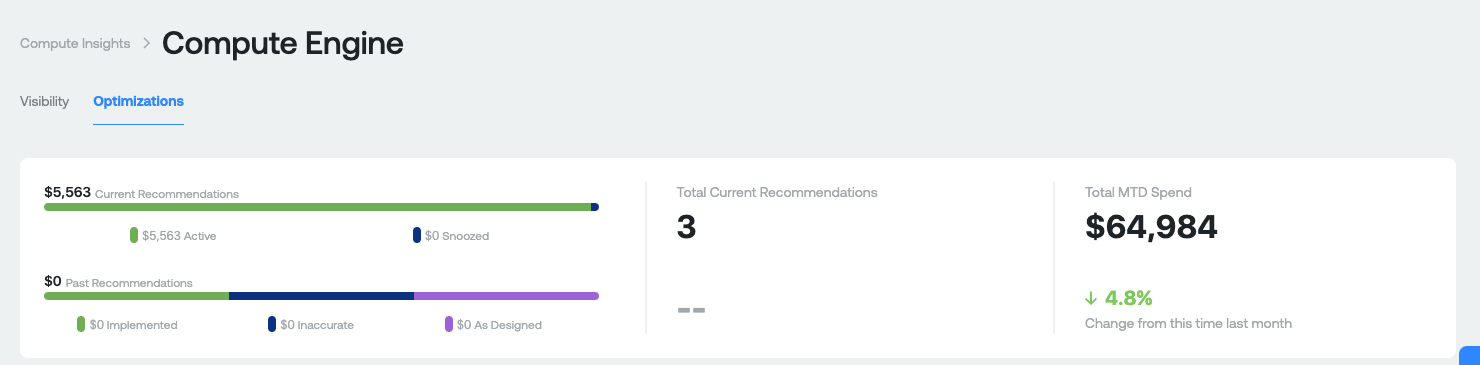
- Current Recommendations: Total amount of savings available across all recommendations. Active represent recommendations that do not have a status of "Snooze". Snoozed represents recommendations that have a status of "Snooze" set by a user for any reason.
- Past Recommendations: Total amount of previous recommendations available across all statuses available in Ternary (these are historical recommendations). Includes recommendations with a status of Implemented, Inaccurate or As-designed after discussion with your engineering team and the appropriate status assigned to the recommendation in ternary.
- Total Current Recommendations: Total number of current recommendations available.
- Total MTD spend: Total gross Compute spend month to date. The percentage represents your amount of MTD spend compared against this time last month.
Compute Recommendation table
Measures:
- ID: Unique ID of the recommendation in the Ternary platform. Each recommendation will have a unique ID for reference later.
- Recommendation type: The type of recommendation (Please see above for a description of possible recommendations).
- Resource (and Project): Unique resource name and associated Project/Account/Subscription it exists in.
- Open: Whether the recommendation has a status of New
- Status: Status of the recommendation, as assigned in the Ternary platform. Possible values: New, Accepted, As-Designed, Implemented, and Inaccurate.
- Created On: The date that the recommendation was created in the Ternary database.
- Potential Savings: Potential savings if the recommendation is actioned.
When you click on any one of the Table Rows, you'll see a pop up appear:

Details of a single recommendation. You can also snooze a recommendation for a specific period of time or set a particular status.
Updated about 2 months ago