Dashboards
Learn how Ternary Dashboards deliver cloud cost visibility with cost reports and customizable views for monitoring, analysis, and sharing spending insights.
Ternary Dashboards provide cloud cost visibility by bringing cost reports and key metrics into a single, customizable view. You can use the Default Dashboard for a high-level summary, System Dashboards for commonly used cost insights, or Custom Dashboards to track metrics specific to your team or business structure.
What types of dashboards does Ternary provide?
System Dashboards
System Dashboards are pre-configured dashboards available to all Ternary customers. They present commonly used cloud cost and usage views based on standard reporting patterns and can be used as-is or copied and customized to meet specific reporting needs. To access System Dashboards, filter by Owner = [email protected], Visibility = Ternary, or use the System tag.
What capabilities do Ternary dashboards support?
Scoped Views
Ternary Scoped Views allow dashboards to reflect data filtered according to an organization’s business structure or taxonomy.
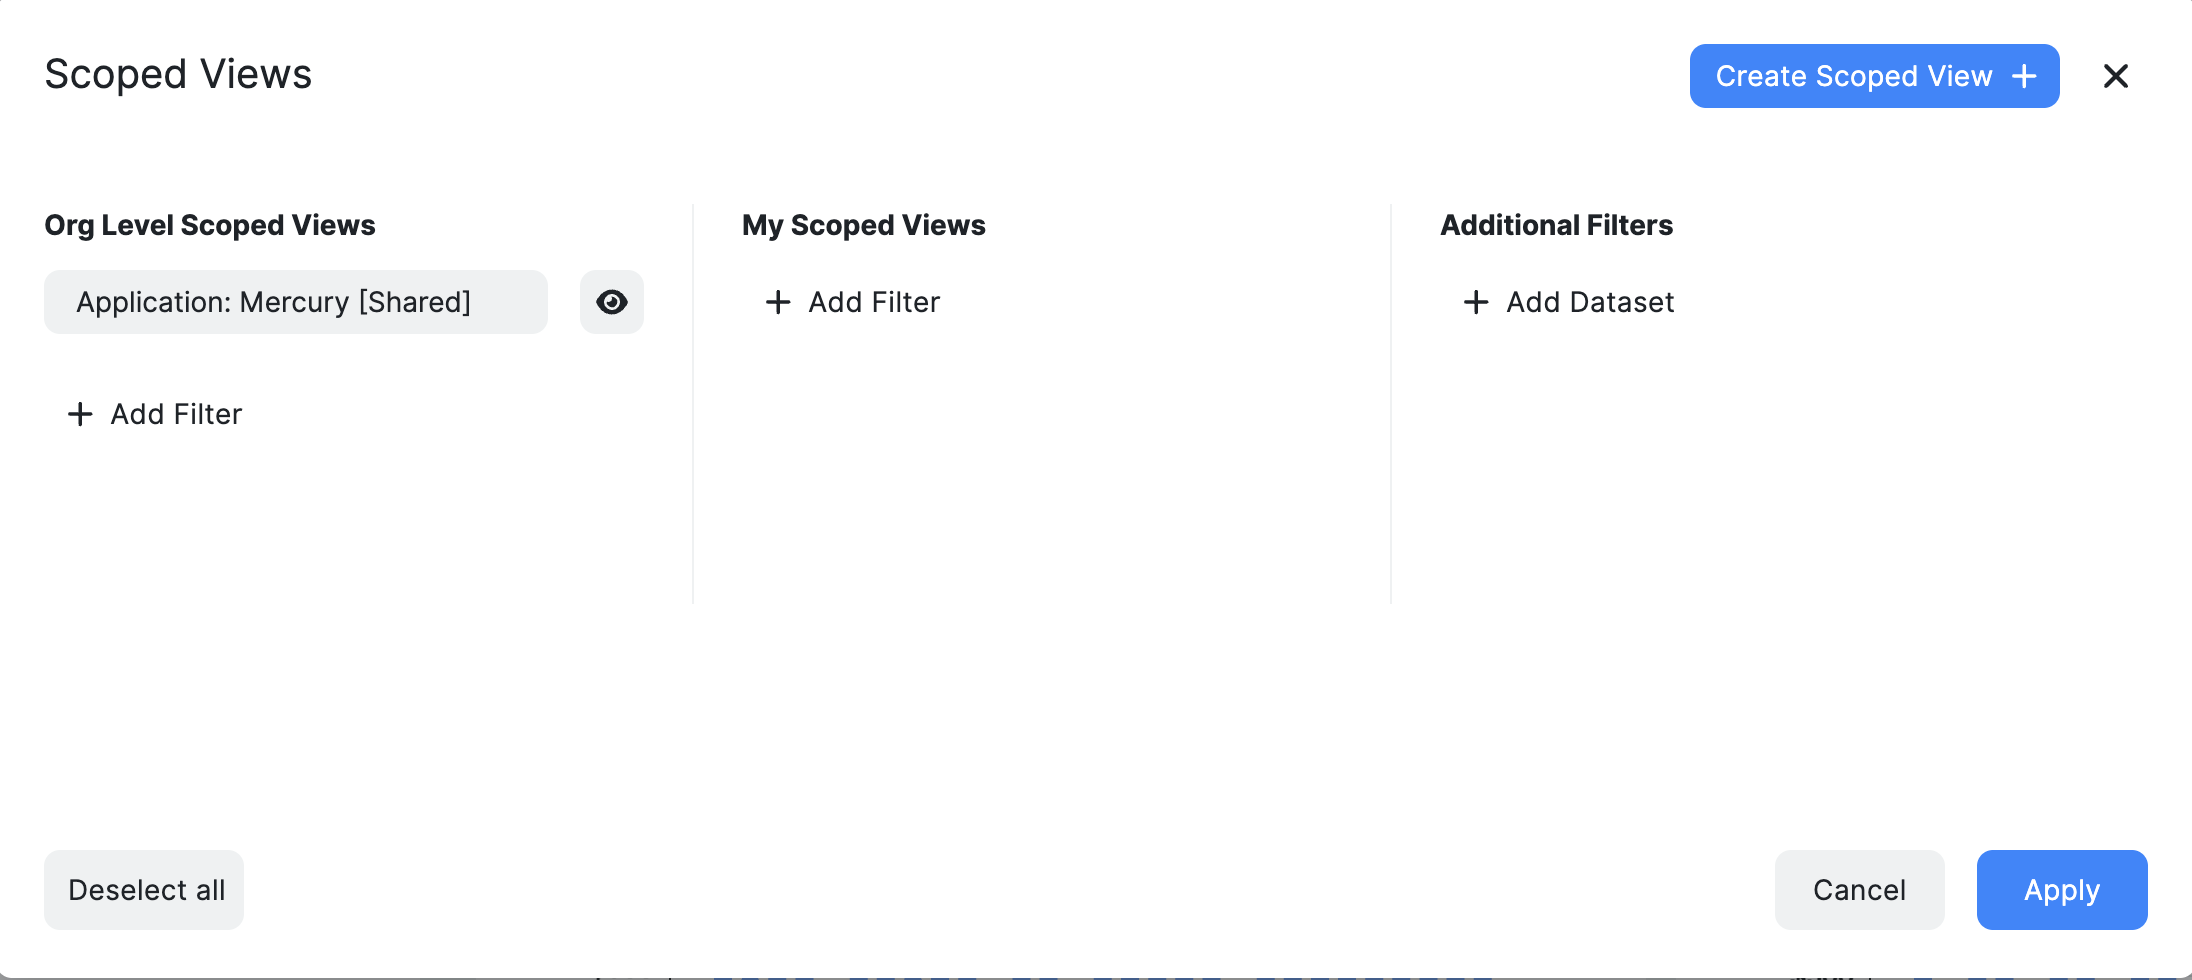
When a Scoped View is applied, all reports and meters on the dashboard are filtered to the associated accounts, projects, or labels. This enables consistent cost visibility by business unit, team, application, or any custom grouping. Learn more about Ternary Scoped Views.
Create cases
Dashboards support direct case creation to track and collaborate on cost-related actions.
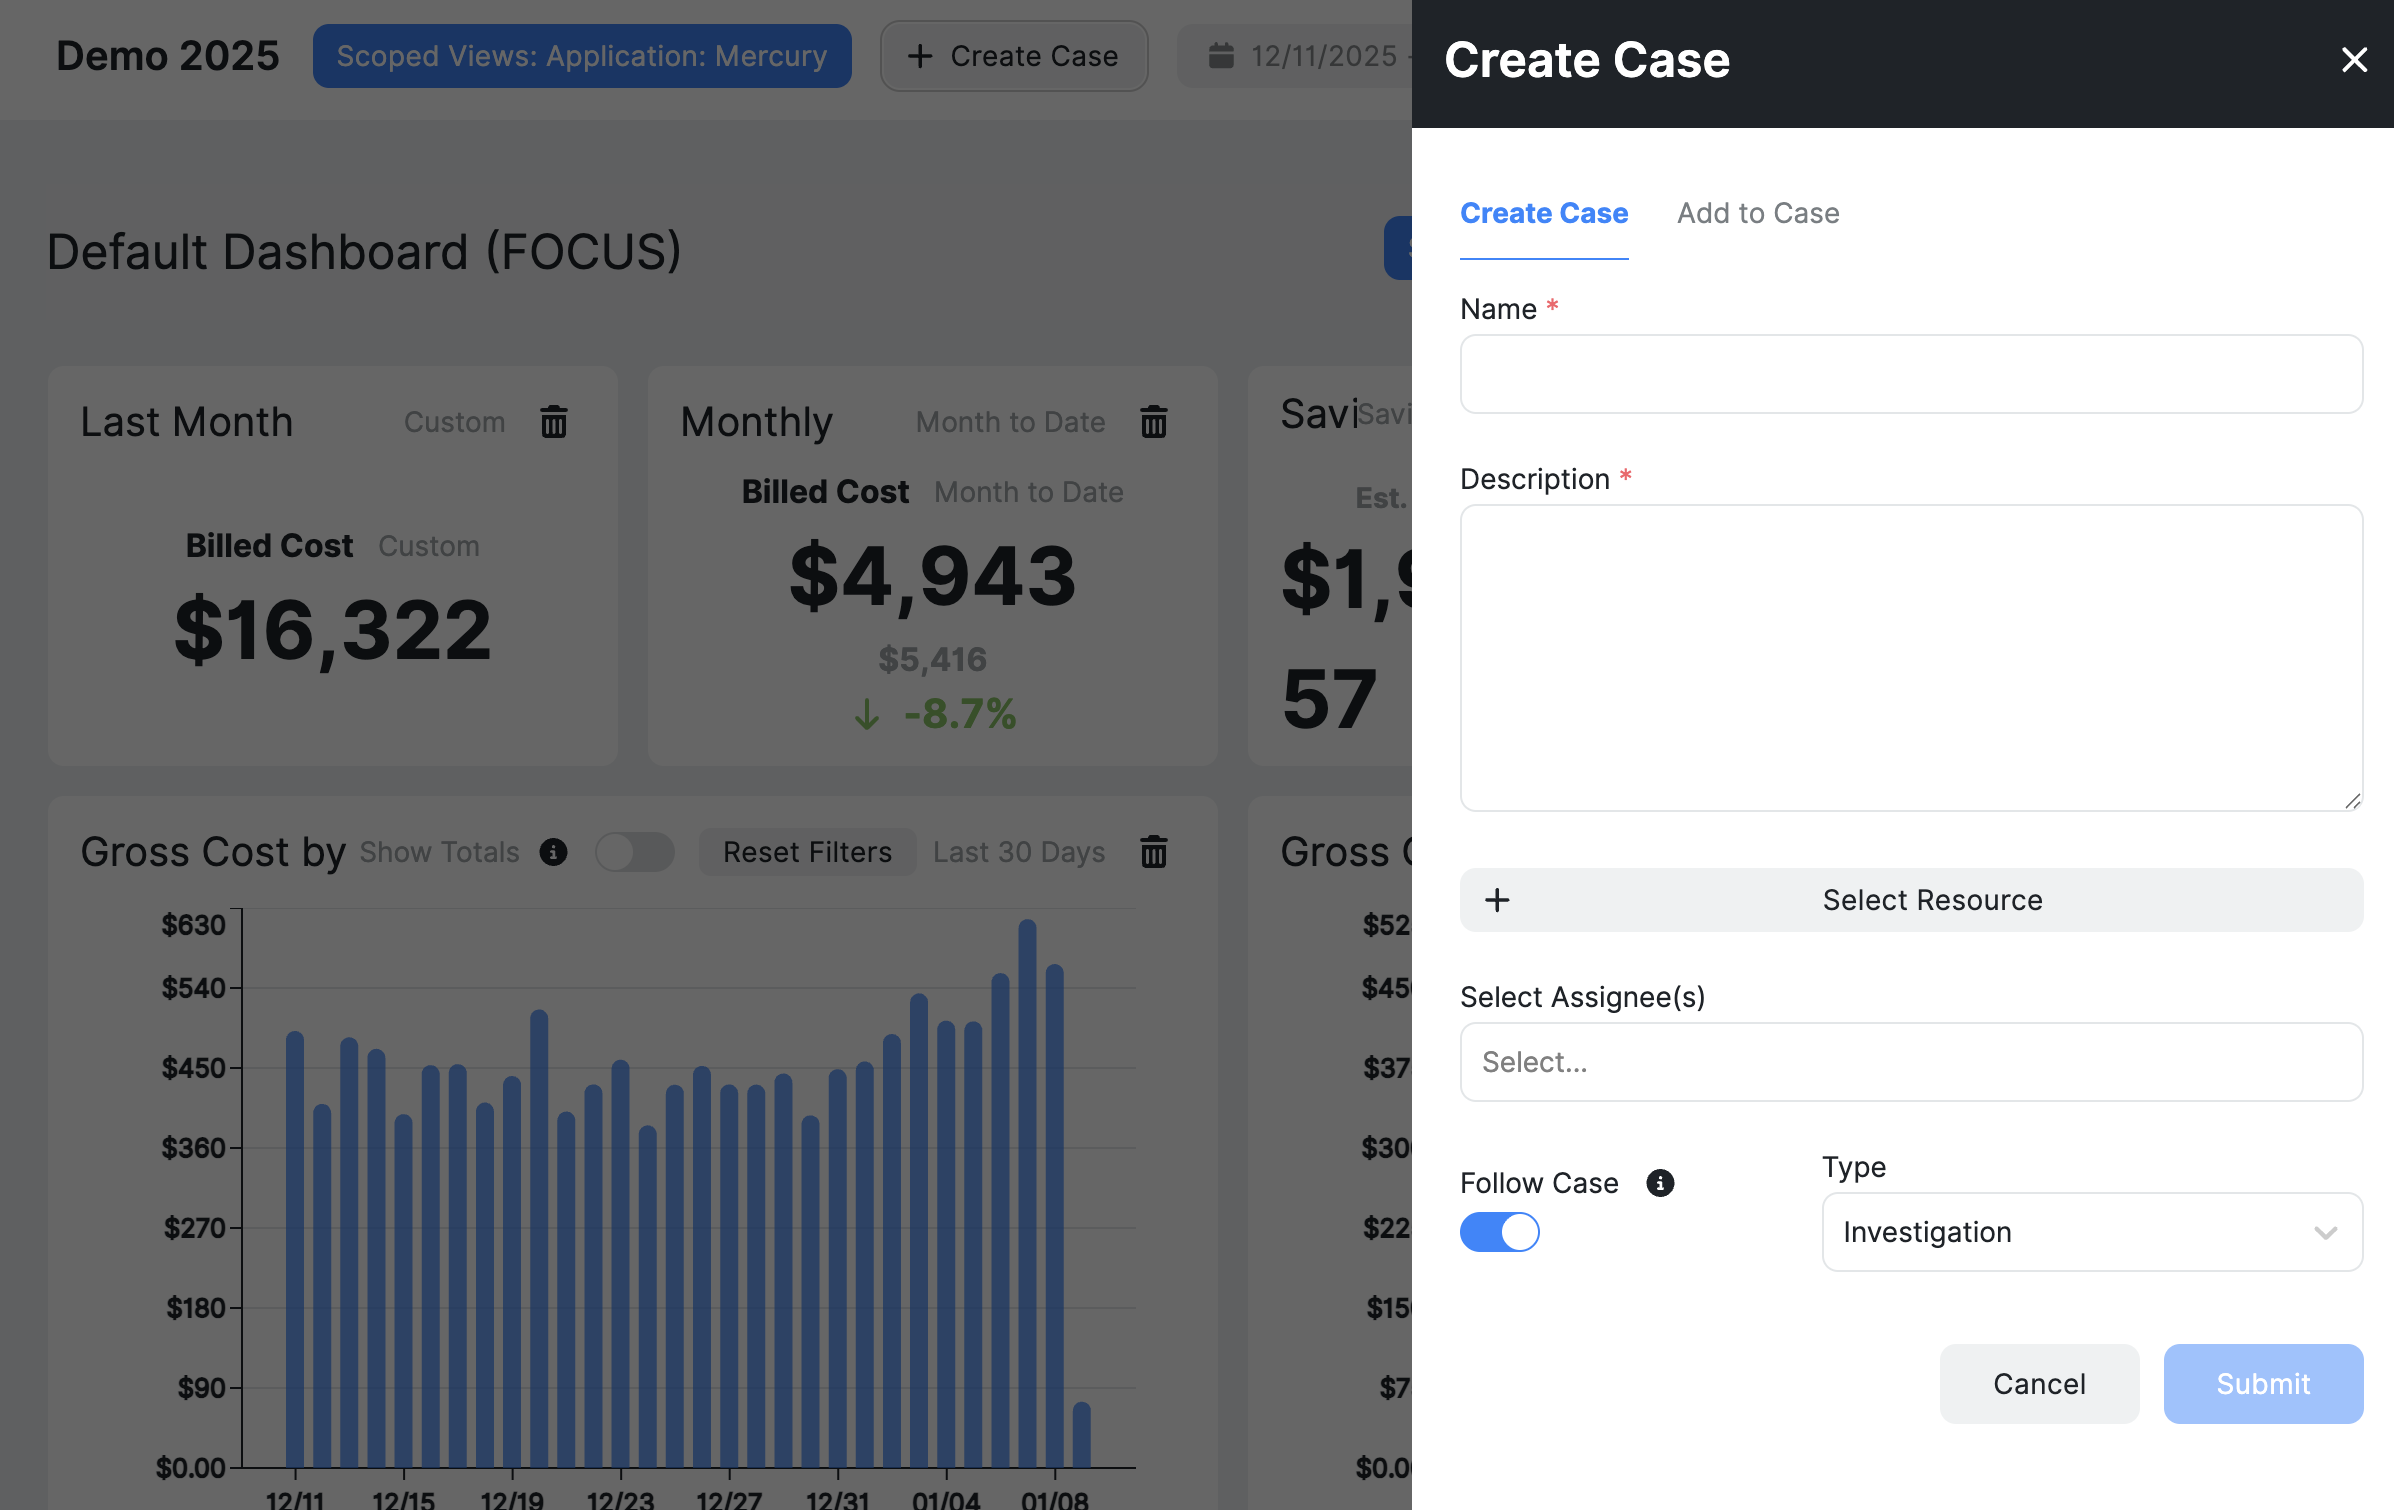
A case can be created in the platform using the Create Case option with a paper & pencil icon in the top toolbar. This allows teams to document findings, assign ownership, and manage follow-ups without leaving the dashboard context. Learn more about Ternary Case Management.
Share dashboards
Dashboards can be shared to support collaboration across teams. Users can generate a unique URL for the dashboard or report they are viewing and share it with other stakeholders.
What reports and KPI widgets are included in the Default Dashboard?
Default reports
The Default Dashboard includes a predefined set of reports designed to provide a quick snapshot of overall cloud spend.
- Gross Cost by Category: Displays gross cloud cost grouped by category.
- Gross Cost by Project: Displays gross cloud cost grouped by project.
- Top 10 Credits by Service Description: Shows the top credits received from cloud providers, organized by service.
- Top 10 SKU Description by Cost: Shows the highest-cost SKUs based on gross spend.
These reports can be explored directly from the dashboard or used as a starting point for deeper analysis in custom dashboards.
Default KPI widgets
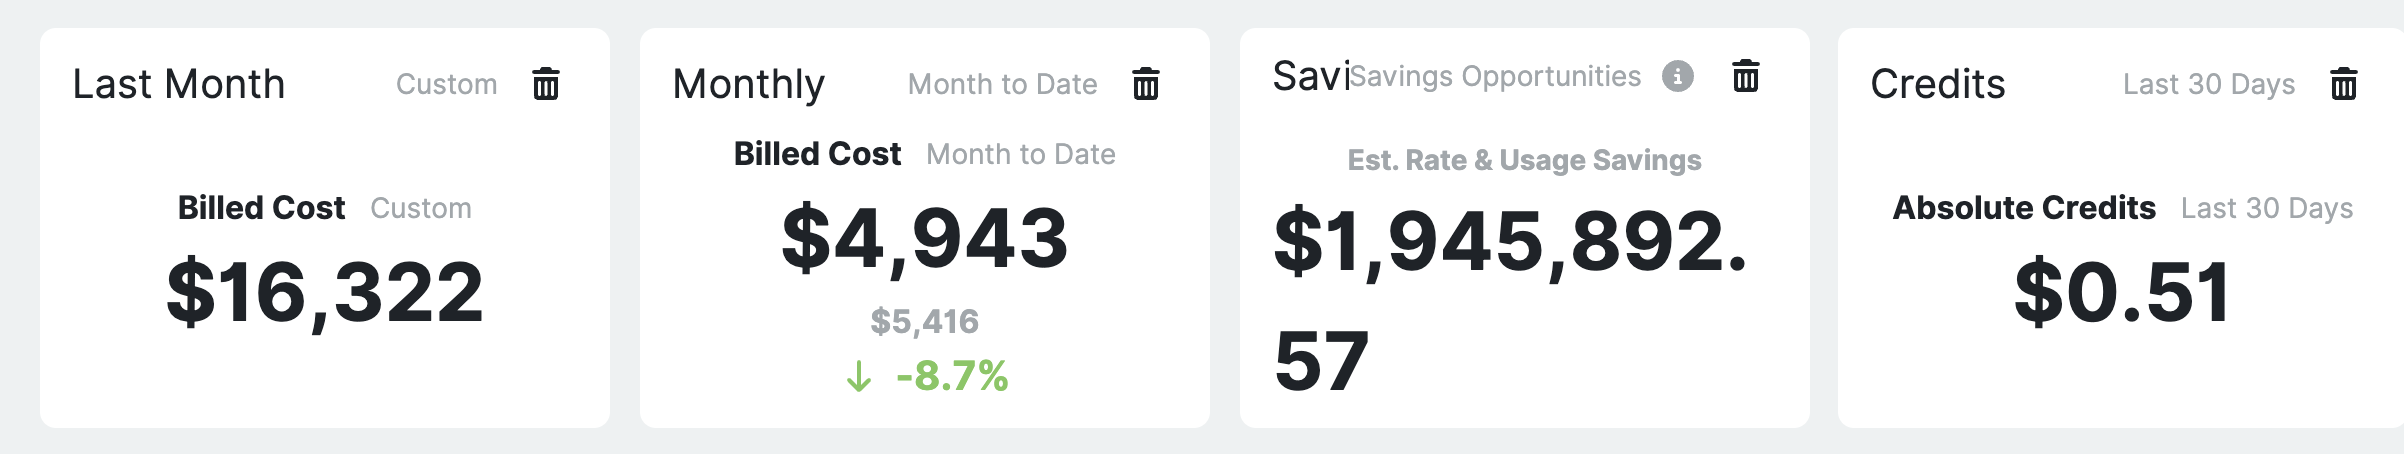
- Last Month Total Spend: Gross cloud spend for the previous month.
- Monthly Spend to Date: Gross spend for the current month to date, with percentage change compared to the same period last month.
- Savings Opportunities: Aggregated potential savings across Compute, Kubernetes, and Storage optimization recommendations. This represents a theoretical maximum if all recommendations were implemented.
- Credits Received: Credits received from cloud provider(s) during the selected period.
How are dashboards managed in Ternary?
Dashboards are managed from the Dashboard Management page, accessible under Ternary Reporting Engine > Dashboards.
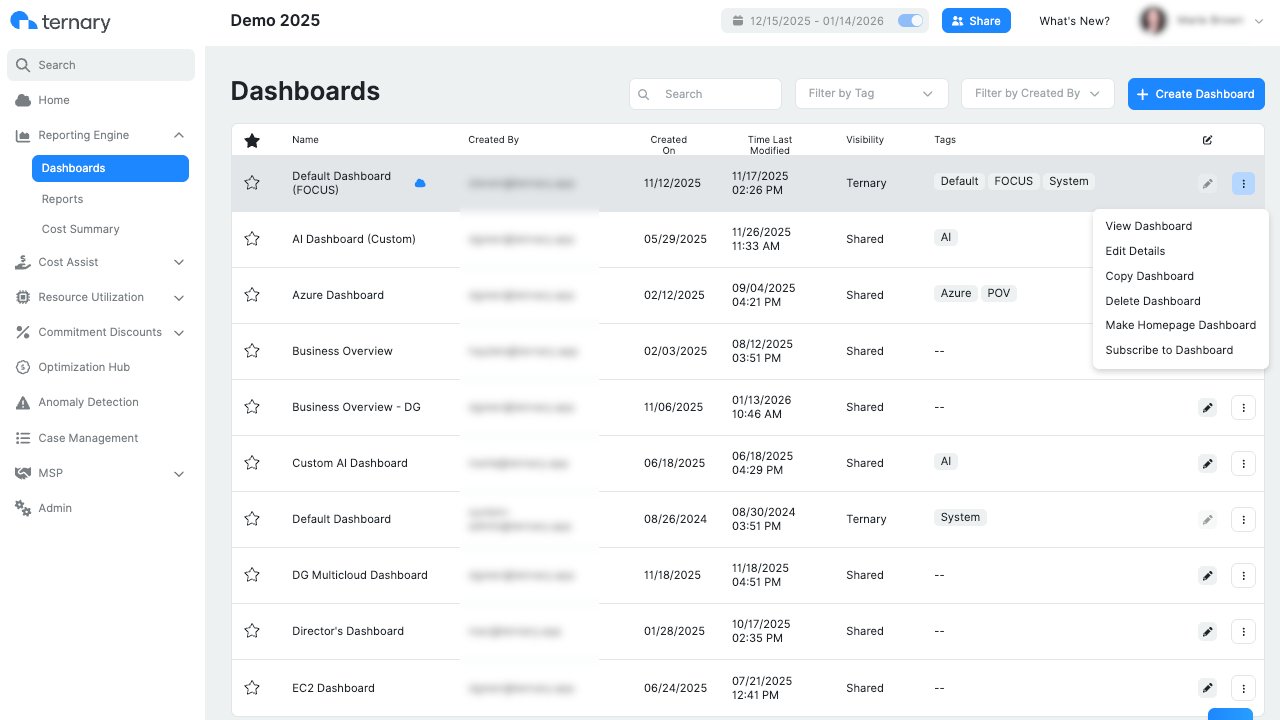
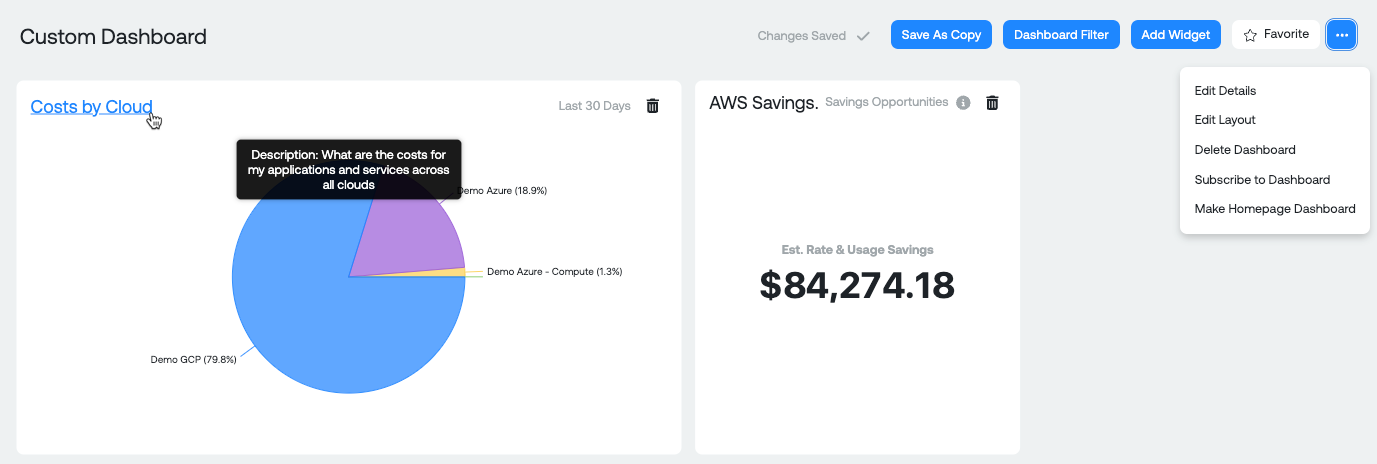
By clicking the ellipses menu next to any dashboard, you can:
- View the selected dashboard
- Edit dashboard details such as name and tags
- Delete dashboards that are no longer needed
- Set a dashboard as the homepage on login
- Create Dashboard Subscription to receive email updates for both Ternary users and external recipients with configurable delivery frequency and timing
- Mark dashboards as favorites for quick access
How to customize a Ternary dashboard?
- Save as Copy: Create a duplicate of an existing dashboard for further customization without modifying the original.
- Dashboard Filter: Set a specific date range for the dashboard to analyze trends over a defined period.
- Edit Layout: Customize the layout of the dashboard by selecting Edit Layout from the ellipses menu. Drag and drop widgets to rearrange or resize for a personalized dashboard design.
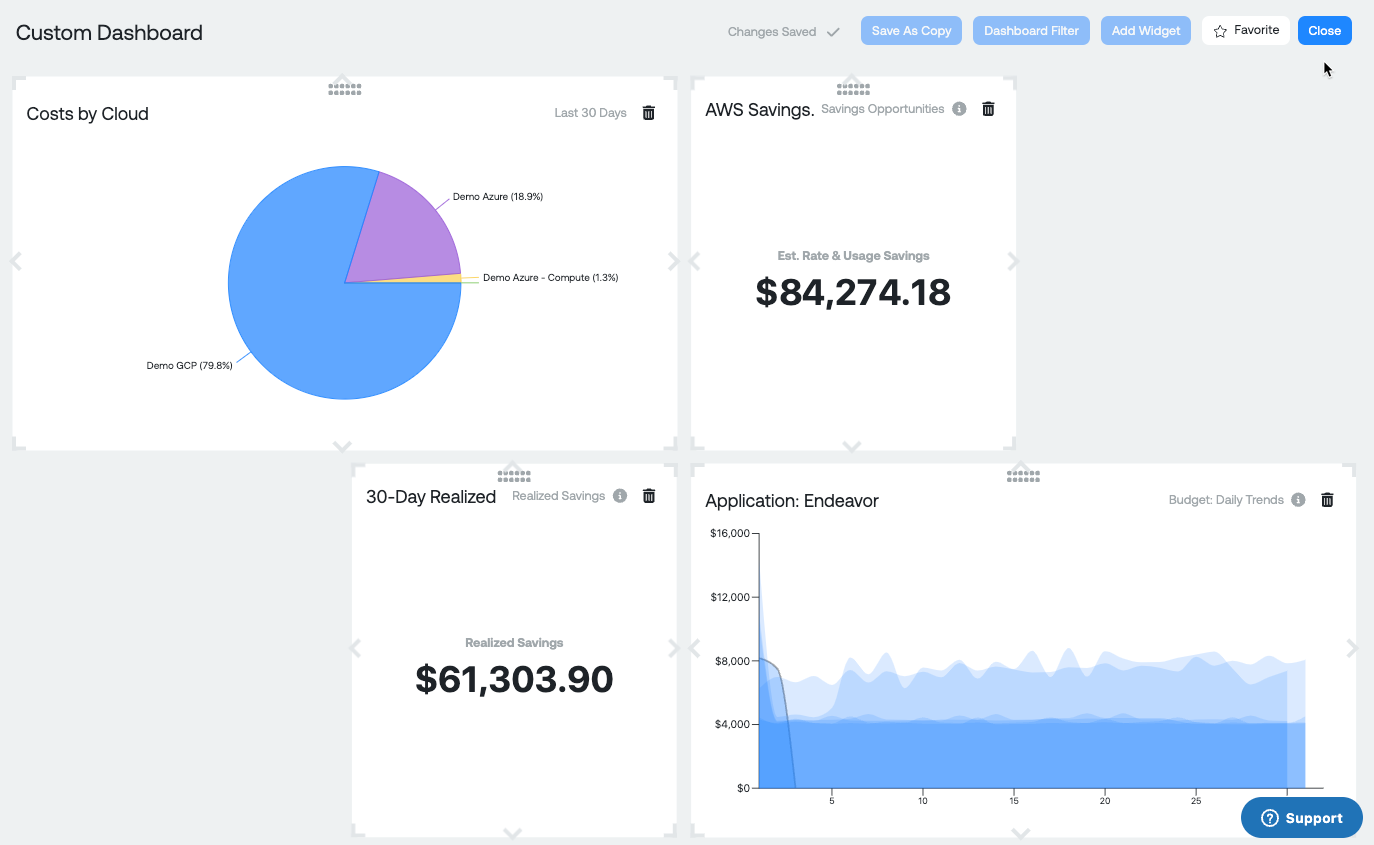
- Add Widget: Widgets help build the dashboard layout, including:
- Report: Display a saved report
- Budget (Daily Trends or Current Month): Track spend against budgets
- Savings Opportunity KPI: View potential savings metrics
- Realized Savings KPI: Track achieved savings
- Custom Text: Add contextual notes or instructions
Up to 25 widgets can be added to a custom dashboard. Hovering over a report name displays its description; otherwise, the full report name is shown.
Changes to dashboards are saved automatically, allowing users to iteratively refine dashboards as reporting requirements evolve.
MSP Dashboard
The MSP Dashboard is designed for Managed Service Providers (MSPs) who need visibility into cloud spend across multiple customers or tenants.
It provides consolidated views tailored to MSP workflows and reporting needs. For detailed information on configuration, usage, and supported capabilities, refer to the dedicated MSP Dashboard documentation.
Updated 6 months ago