Kubernetes Insights
The Kubernetes Insights pages support the following services:
- Amazon EKS
- Azure Kubernetes Service (AKS)
- Google Kubernetes Engine
Amazon EKS
Prerequisites
For a complete list of Kubernetes metric definitions please see our supportingdocumentation.
Our sources of truth for the metrics are CloudWatch. We use a combination of these to pull the metrics and to understand what Accounts your clusters are running in.
Those metrics in combination with the pricing table allow us to do the required calculations.
AWS EKS Visibility Summary
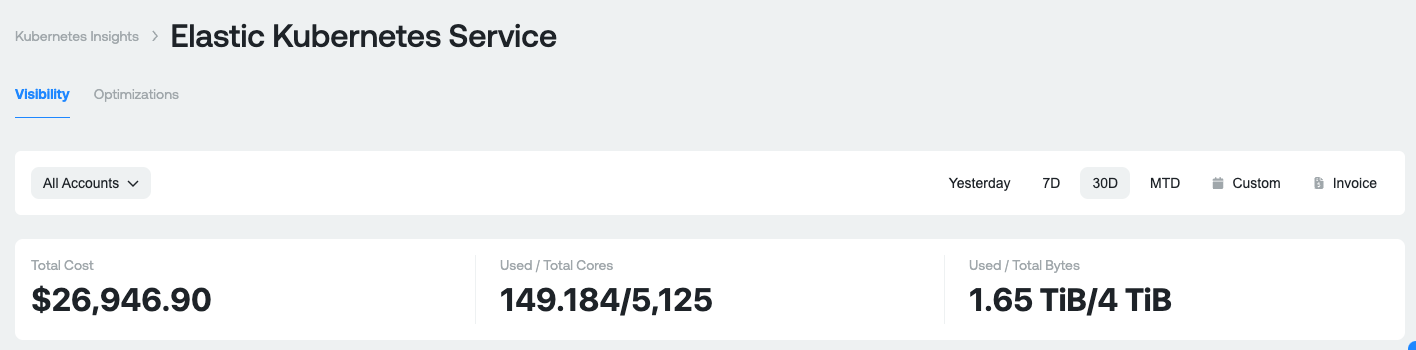
Purpose: This section is designed to give you a high level overview of what you're spending on AWS EKS at the Cluster level in your accounts.
Measures:
- Total Cost: Total cost of all of the associated clusters. This is gross cost and does not include any GCP related discounts you receive.
- Used / Total Cores: The first number if the number of used cores and the second is the amount of total allocated cores to all the clusters.
- Used / Total Bytes: The first number is the amount of used ram and the second is the amount of total allocated ram to all the clusters.
You are able to switch the timeframe using the date fields

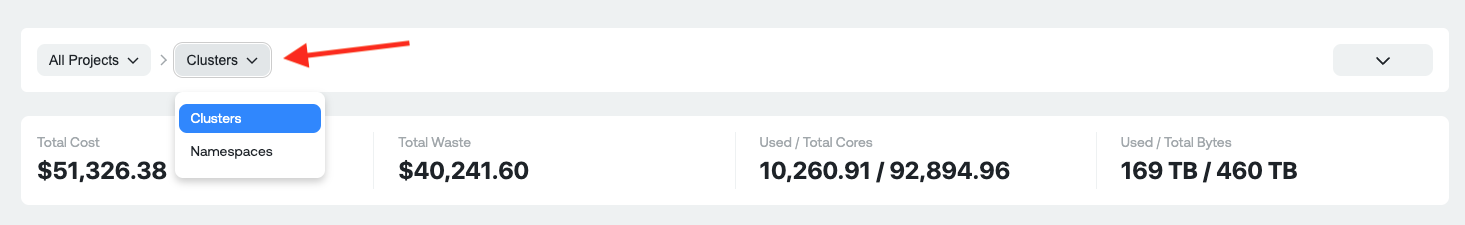
You can also switch between a cluster view and a namespace view.
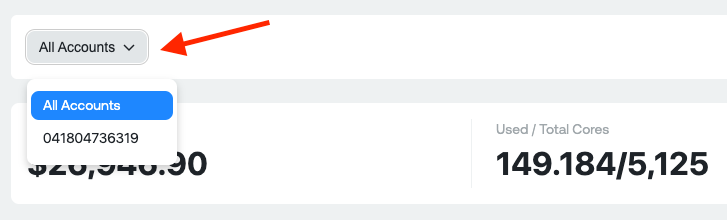
You also have the ability to narrow the scope to a particular Account or include All Accounts
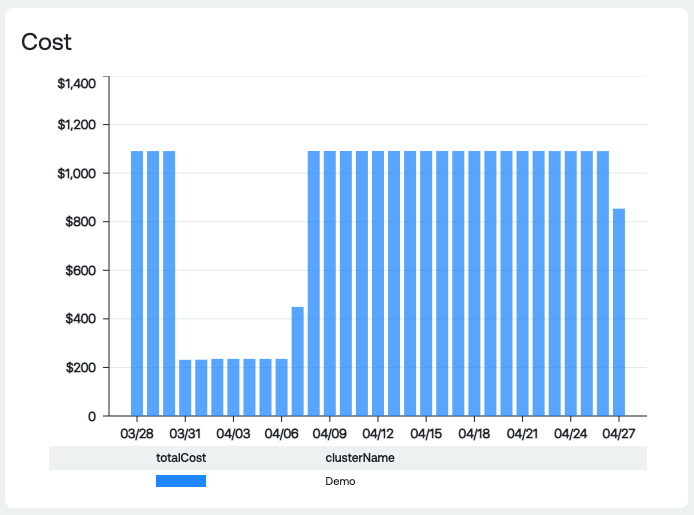
Cost and Usage Graphs
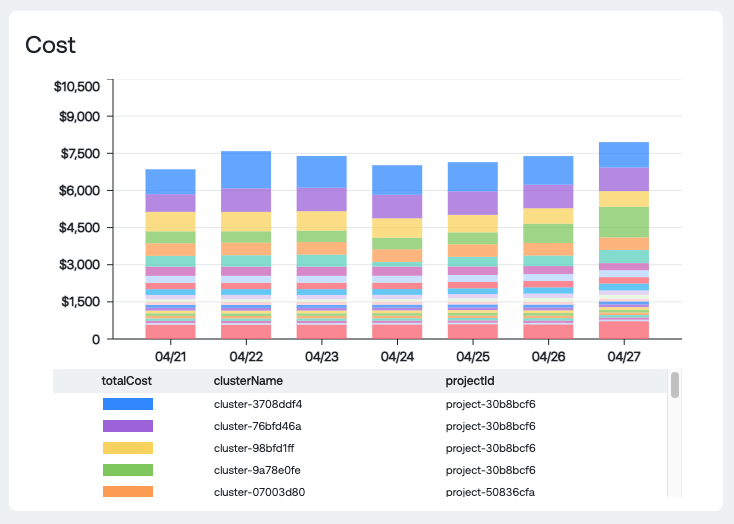
Cost Graph
Dimension Groupings:
- The graph is grouped by cluster and by account.
All Clusters in All Accounts
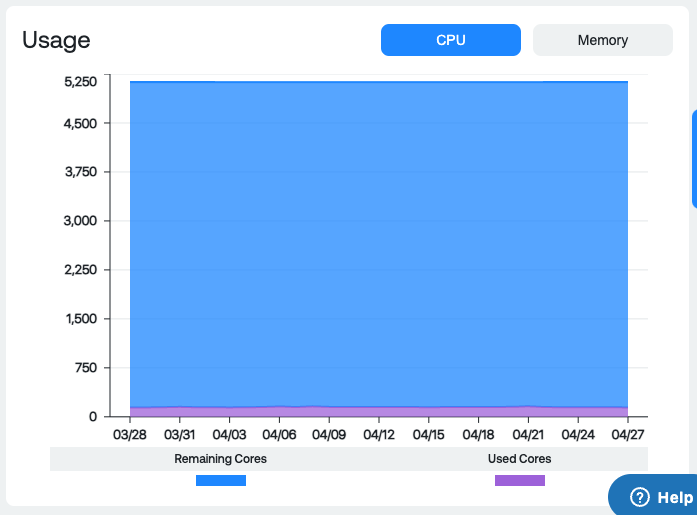
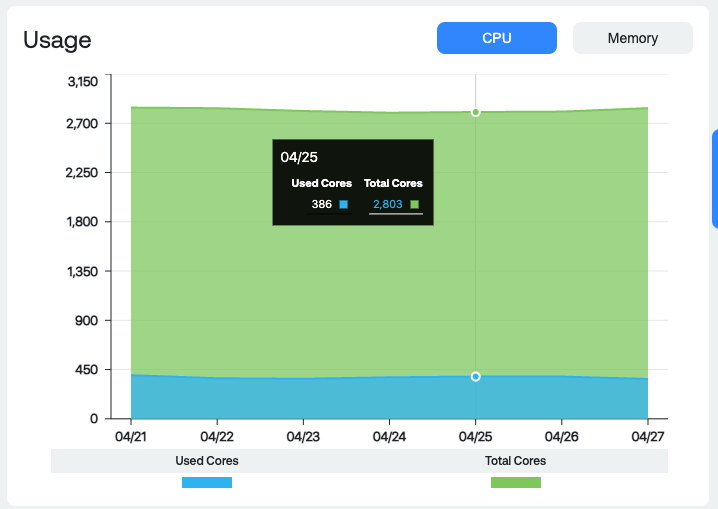
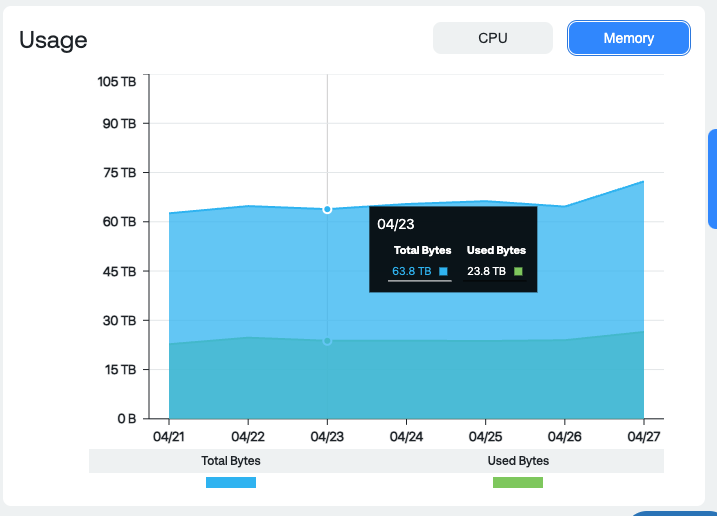
Usage Graph
Dimension Groupings:
- CPU: Total amount of allocated cores and total amount of used cores in all clusters and accounts (can narrow scope to individual accounts or clusters using the above functionality)
- Memory: Total amount of allocated memory and total amount of used memory in all clusters and accounts (can narrow scope to individual accounts or clusters using the above functionality)
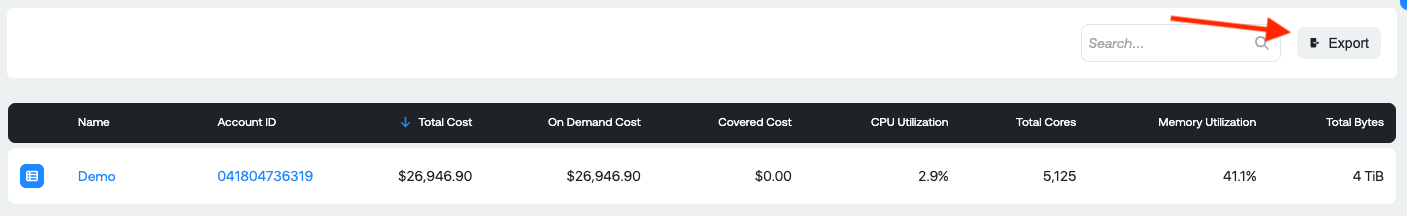
Cluster Table
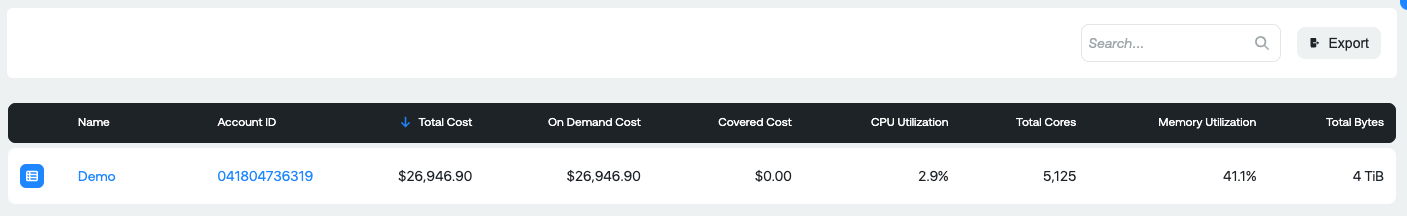
Measures:
- Name: Cluster Name
- Account ID: AWS Account where cluster is running
- Total Cost: Total Core and Memory cost
- On-Demand Cost: Total cost of clusters running on-demand and without Savings Plans or Reserved Instances covering the usage
- Covered Cost: Amount of cost covered by Savings Plans and Reserved Instances
- CPU Utilization: Average CPU utilization over the selected time period
- Total Cores: Total number of allocated cores to the cluster
- Memory Utilization: Average memory utilization over the selected time period
- Total Bytes: Total amount of allocated memory
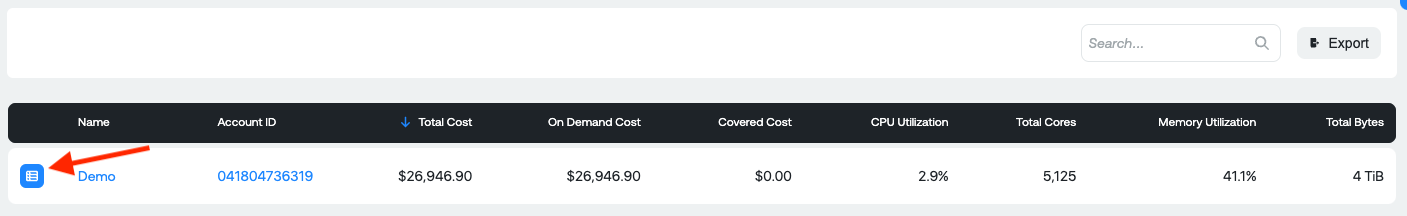
View Instances
View Instances Table
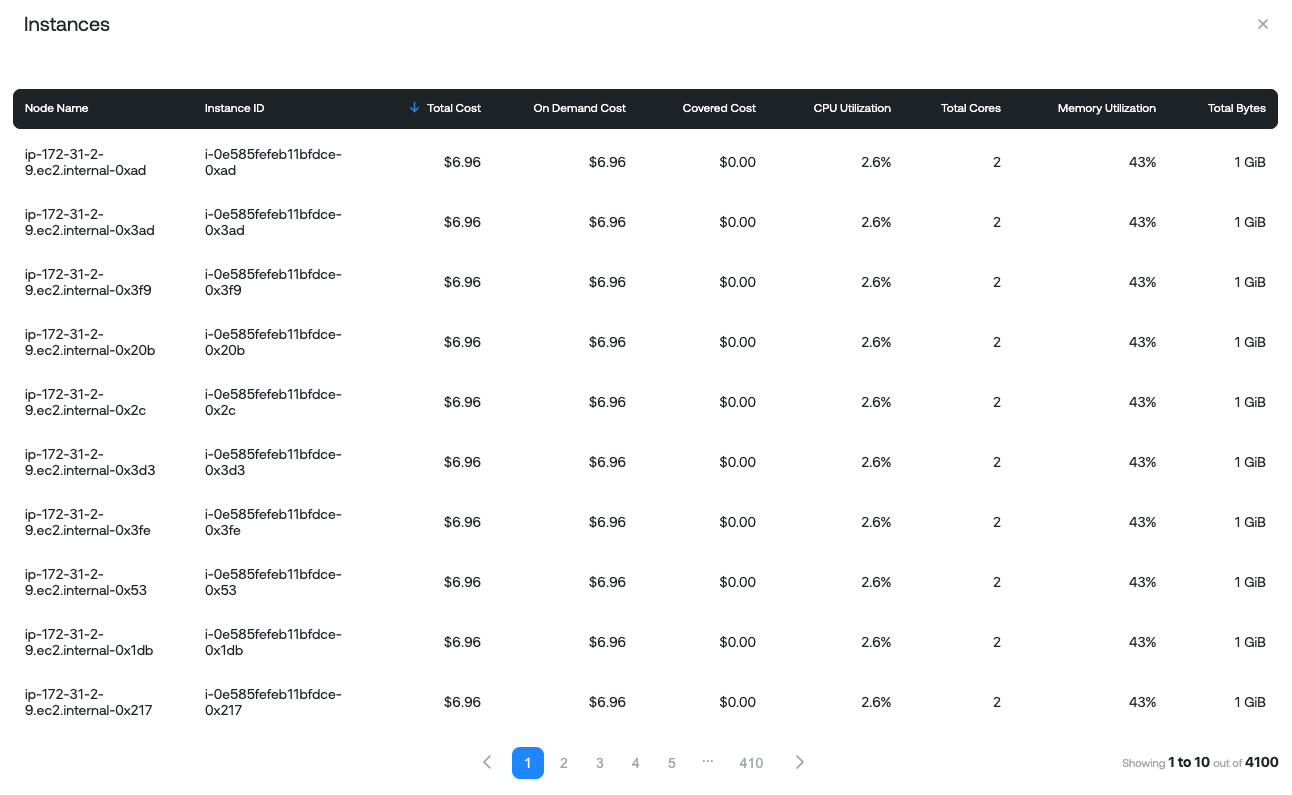
Measures:
- Node Name: Name of the node running in the cluster
- Instance Id: Unique resource ID of the node
- Total Cost: Total cost to run the node
- On Demand Cost: Total on-demand cost of running node
- Covered Cost: Total covered (RI/SP) cost of running node
- CPU Utilization: Average CPU utilization
- Total Cores: Number of cores on the node
- Memory Utilization: Average memory utilization
- Total Bytes: Amount of memory on the node
Other Useful Functionality
Export Visibility and Optimizations: Export the current Visibility categories and Compute optimization recommendations as CSVs
For Visibility, you can export the categories table below the graph
GKE
Prerequisites
Ternary is agentless and uses GCP's Cloud Monitoring to power our Kubernetes Insights page. If you do not have Cloud Monitoring enabled the Insights page will not populate with your Kubernetes usage and cost.
Enabling Cloud Monitoring: https://cloud.google.com/stackdriver/docs/solutions/gke
If you have enabled Cloud Monitoring, you can replicate this Metrics Explorer Query in the GCP console to validate that metrics are being generated in the GCP console:
metric: Kubernetes Container - CPU Usage Time

filters: project_id=<your project_id>

groupingFunction: Sum

groupByLabels:
  - cluster_name
  - node_name
  - top_level_controller_name
  - top_level_controller_type
  - container_name
  - location
  - namespace_name
  - pod_name

perSeriesAligner: Rate

alignmentPeriod: 1h
If you are not seeing metrics in the GCP console, one possibility is that there is a permissions issue publishing metrics to the console. One cause, is if custom service accounts are being used vs the default compute engine service account from GCP. You can check your custom service accounts for the following roles:
roles/logging.logWriter
roles/monitoring.metricWriter
roles/stackdriver.resourceMetadata.writer
For a complete list of Kubernetes metric definitions please see our supportingdocumentation.
Our sources of truth for the metrics are Stackdriver, Cloud Asset Inventory and a Pricing Table. We use a combination of these to pull the metrics and to understand what projects your clusters are running in. Some of the resources we inspect are:
- workloads (pods, deployments, statefulset, etc)
- namespaces
- nodes
- location
- machine family
- request and limits
- usage
- projects with clusters
Those metrics in combination with the pricing table allow us to do the required calculations.
We recommend that each GKE cluster have cost-allocation enabled. GKE autopilot clusters will have it enabled by default but standard and older GKE clusters may not have it enabled. Google documentation on enabling GKE cost allocation: https://cloud.google.com/kubernetes-engine/docs/how-to/cost-allocations#enable_breakdown
By enabling this, additional details are added to the detailed billing export which allows Ternary to calculate the costs for your GKE standard clusters. If you do not have it enabled, you only receive cost data for GKE autopilot clusters (which have cost allocation enabled by default).
GKE Visibility Summary
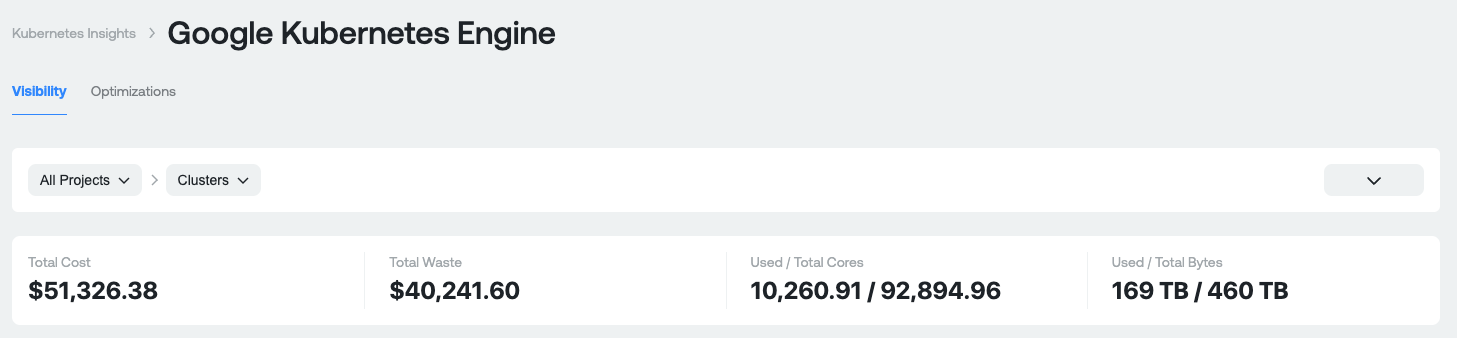
Purpose: This section is designed to give you a high level overview of what you're spending on GCP GKE at the Cluster and Namespace level within your GCP Projects.
Measures:
- Total Cost: Total cost of all of the associated clusters. This is gross cost and does not include any GCP related discounts you receive.
- Total Waste: Total waste of all the clusters (unused Cores and RAM). This is gross cost and does not include any GCP related discounts you receive.
- Used / Total Cores: The first number if the number of used cores and the second is the amount of total allocated cores to all the clusters.
- Used / Total Bytes: The first number is the amount of used ram and the second is the amount of total allocated ram to all the clusters.
You are able to switch the timeframe between 7/14/30 days using the small arrow on the right hand side.
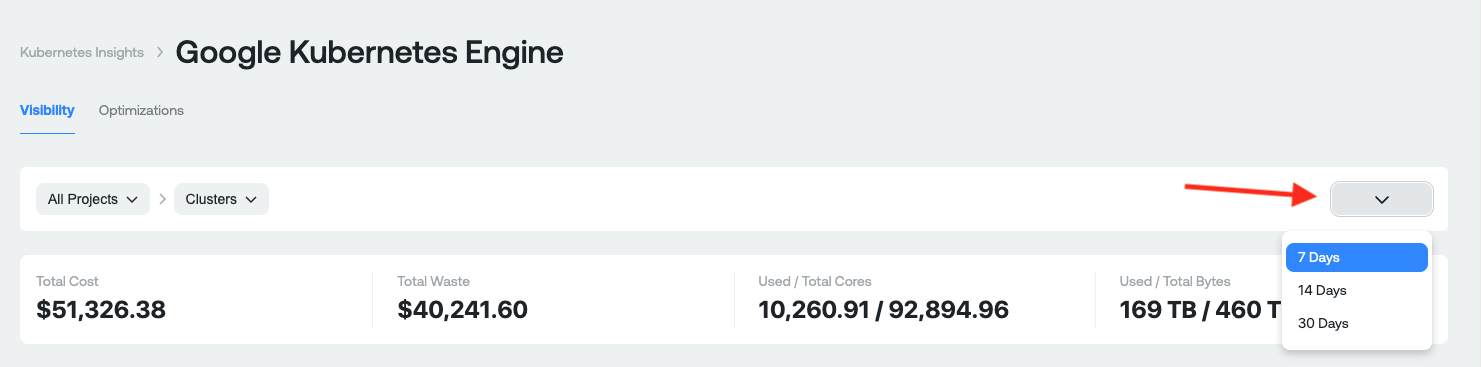
You can also switch between a cluster view and a namespace view.

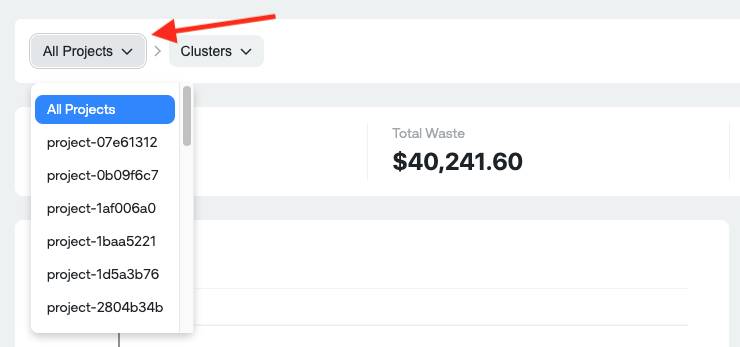
You also have the ability to narrow the scope to a particular Project or include All Projects.
Cost and Usage Graphs
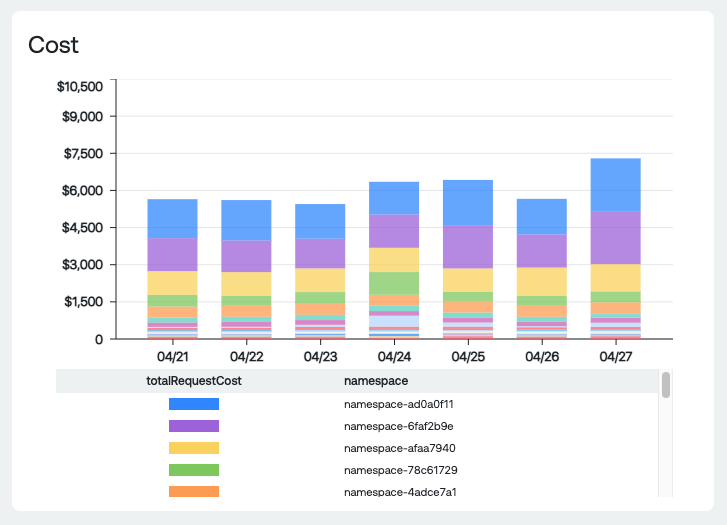
Cost Graph
Dimension Groupings:
- The graph is grouped by cluster, when viewing by cluster or namespace when viewing by namespace. The cost is grouped by cluster/namespace and the associated project.
All Clusters in All Projects
All Namespaces in All Projects
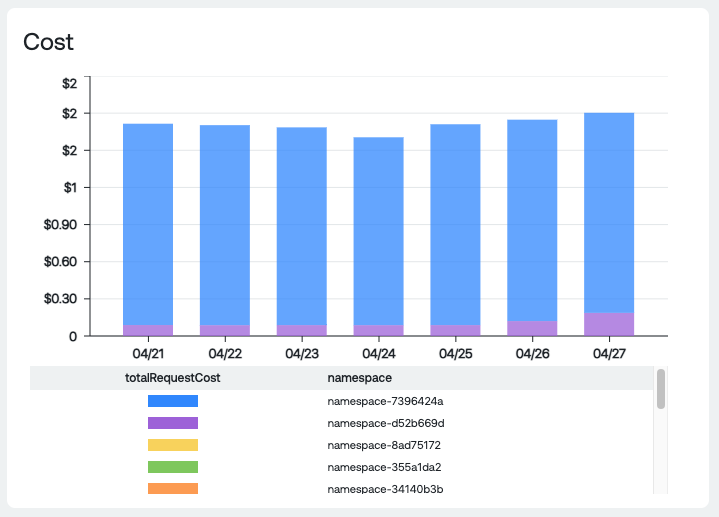
All Namespaces filtered to a single project
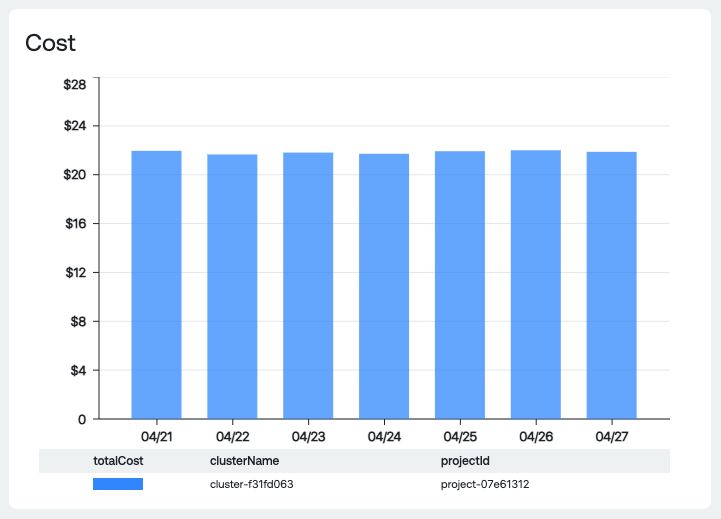
All Clusters in a Single Project
Usage Graph
Dimension Groupings:
- CPU: Total amount of allocated cores and total amount of used cores
- Memory: Total amount of allocated memory and total amount of used memory
Tables
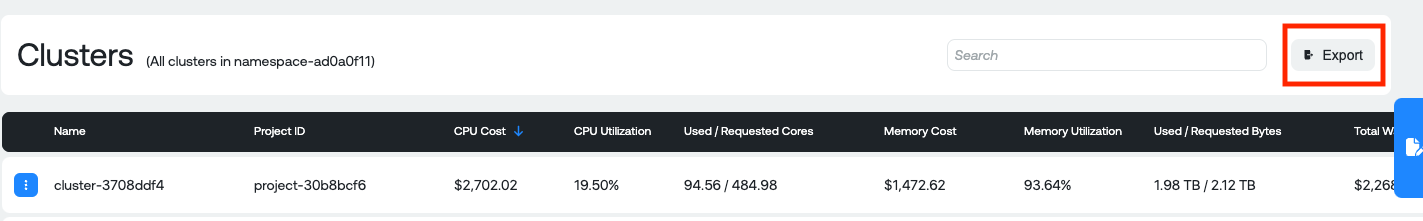
Cluster Table
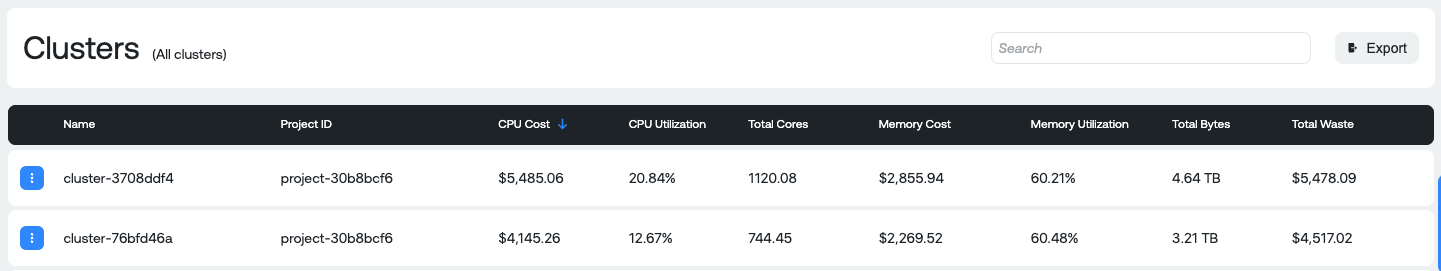
Measures:
- CPU Cost: Total cost of all the cores
- CPU Utilization: Average CPU utilization over the time period selected. Requested Cores / Used Cores for each day and aggregated to get an average
- Total Cores: Total number of cores allocated to the cluster
- Memory Cost: Total cost of all allocated memory
- Memory Utilization: Average memory utilization over the time period selected. Requested memory / Used memory
- Total Bytes: Total allocated memory bytes to the cluster in GB/TB
- Total Waste: Amount of waste in unused CPU and Memory in dollars
Namespace Table
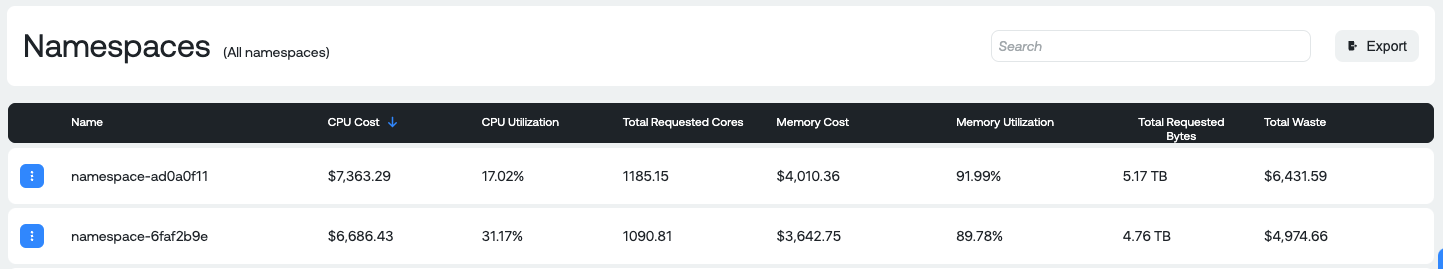
- CPU Cost: Total cost of all the cores
- CPU Utilization: Average CPU utilization over the time period selected. Requested Cores / Used Cores for each day and aggregated to get an average
- Total Requested Cores: Total number of cores requested by the namespace
- Memory Cost: Total cost of all allocated memory
- Memory Utilization: Average memory utilization over the time period selected. Requested memory / Used memory
- Total Requested Bytes: Total requested memory bytes by the namespace in GB/TB
- Total Waste: Amount of waste in unused CPU and Memory in dollars Requested vs Used
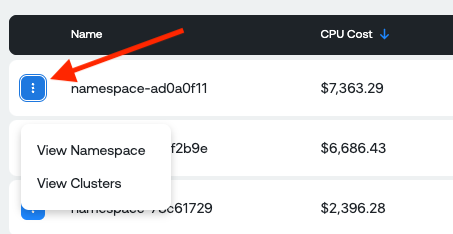
Additional Details by Namespace or Cluster
For example, you could see namespaces associated with a particular cluster or the cluster associated with a particular namespace.
GKE Optimization Summary
Before diving into what the recommendation insights numbers are, it is important to know the different types of recommendations that are potentially surfaced in Ternary for GCP GKE:
- Over provisioned Workload: The amount of CPU and RAM being used by this workload consistently does not match the level of allocation of CPU and RAM to the workload as defined in the Pod specification.
- Nodepool Utilization: The identified nodepool seems to be consistently underutilized. The amount of workload scheduled to the nodepool is lower than the total capacity of the nodepool.
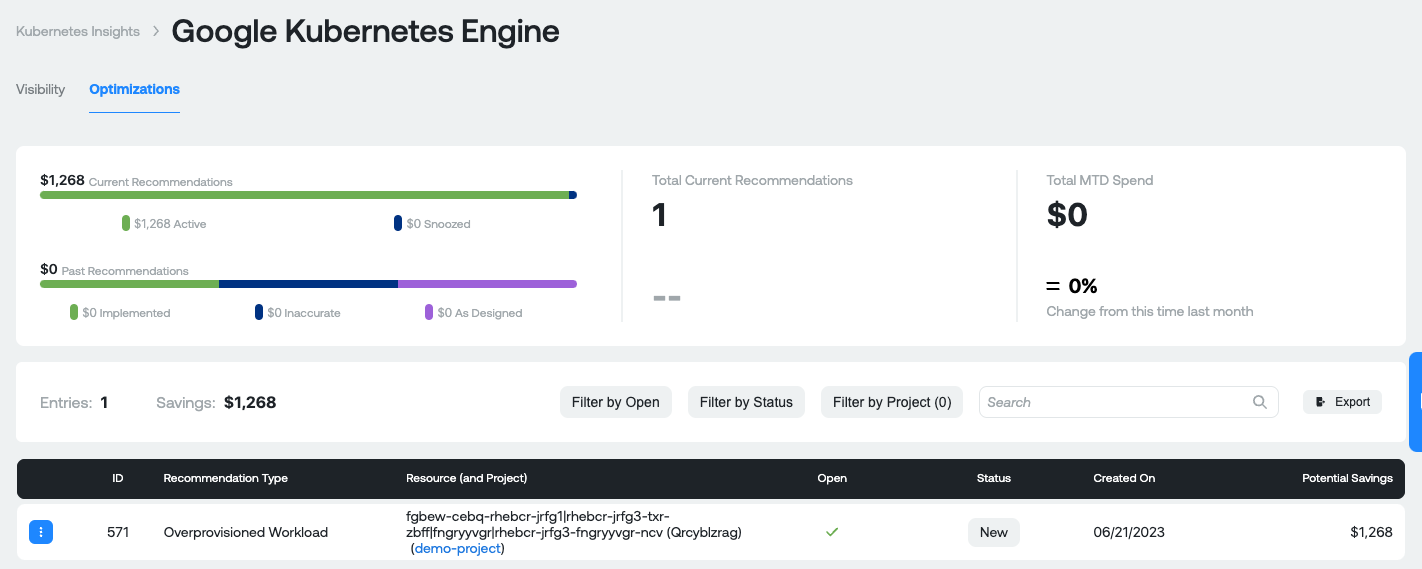
Measures:
- Current Recommendations: Total amount of savings available across all recommendations. Active represent recommendations that do not have a status of "Snooze". Snoozed represents recommendations that have a status of "Snooze" set by a user for any reason.
- Past Recommendations: Total amount of previous recommendations available across all statuses available in Ternary (these are historical recommendations). Includes recommendations with a status of Implemented, Inaccurate or As-designed after discussion with your engineering team and the appropriate status assigned to the recommendation in ternary.
- Total Current Recommendations: Total number of current recommendations available.
- Total MTD spend: Total gross GKE spend month to date. The percentage represents your amount of MTD spend compared against this time last month.
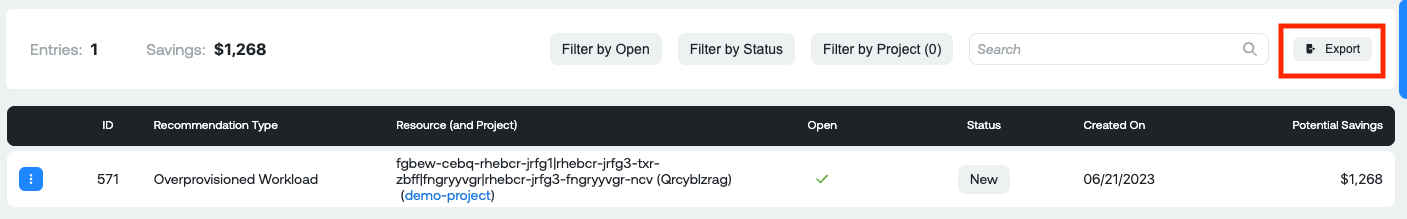
GKE Recommendation table
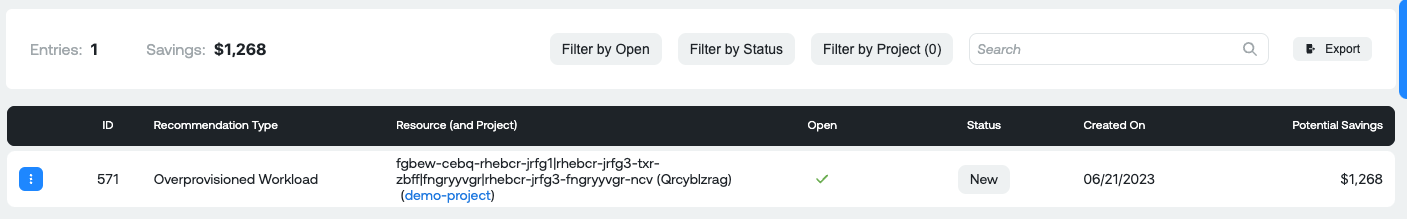
Measures:
- ID: Unique ID of the recommendation in the Ternary platform. Each recommendation will have a unique ID for reference later.
- Recommendation type: The type of recommendation (Please see above for a description of possible recommendations).
- Resource (and Project): Unique resource name and associated Project it exists in.
- Open: Whether the recommendation has a status of New
- Status: Status of the recommendation, as assigned in the Ternary platform. Possible values: New, Accepted, As-Designed, Implemented, and Inaccurate.
- Created On: The date that the recommendation was created in the Ternary database.
- Potential Savings: Potential savings if the recommendation is actioned.
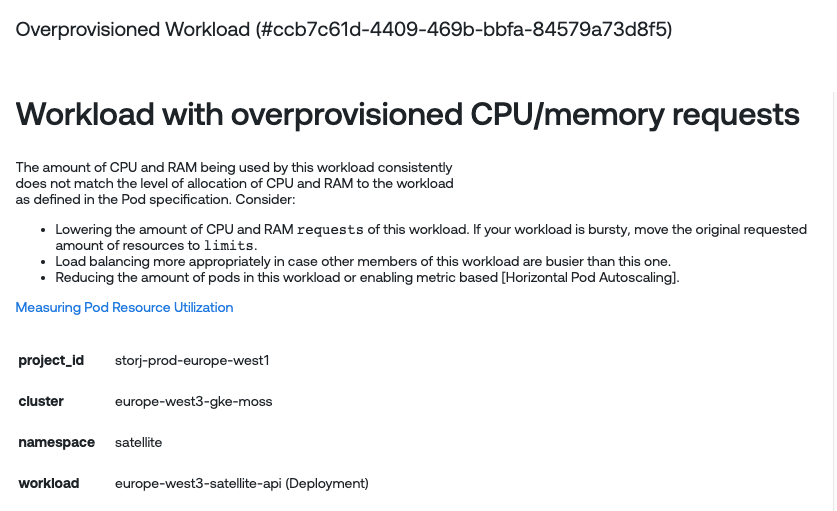
When you click on any one of the Table Rows, you'll see a pop up appear:

Details of a single recommendation. You can also snooze a recommendation for a specific period of time or set a particular status.
Other Useful Functionality
Export Visibility and Optimizations: Export the current Visibility categories and Compute optimization recommendations as CSVs
For Visibility, you can export the categories table below the graph
For Optimizations, you can export the recommendations table below the graph
Knowing where you are: In the project ->cluster ->namespace -> workload -> drill down you can orient where you are and navigate back by using the breadcrumbs on the top left of the screen:
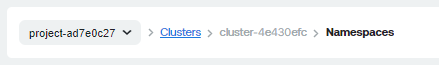
Updated 2 months ago