Forecasting
Learn how Ternary Forecasting projects future cloud spend using historical cost trends, flexible lookback periods, and configurable time-based forecasts.
Ternary Forecasting helps teams estimate future cloud spend based on historical cost patterns. It supports flexible time granularity, including daily, weekly, and monthly views. The forecast calculation leverages a customizable lookback period, ranging from 30 days to 24 months, to analyze historical spending patterns and generate accurate cost predictions. Additionally, you can define a lookahead range of 1 to 24 months, offering greater visibility into future spending trends.
Forecasting is commonly used to anticipate budget risk, understand cost growth trends, and support financial planning decisions.
Ternary Forecasting can be accessed from the Cost Assist section in the left-hand navigation menu.
How does cloud cost forecasting work in Ternary
Forecasting in Ternary analyzes historical spend patterns and projects future costs based on the selected time range, granularity, and forecasting parameters. Here’s how you can customize it:
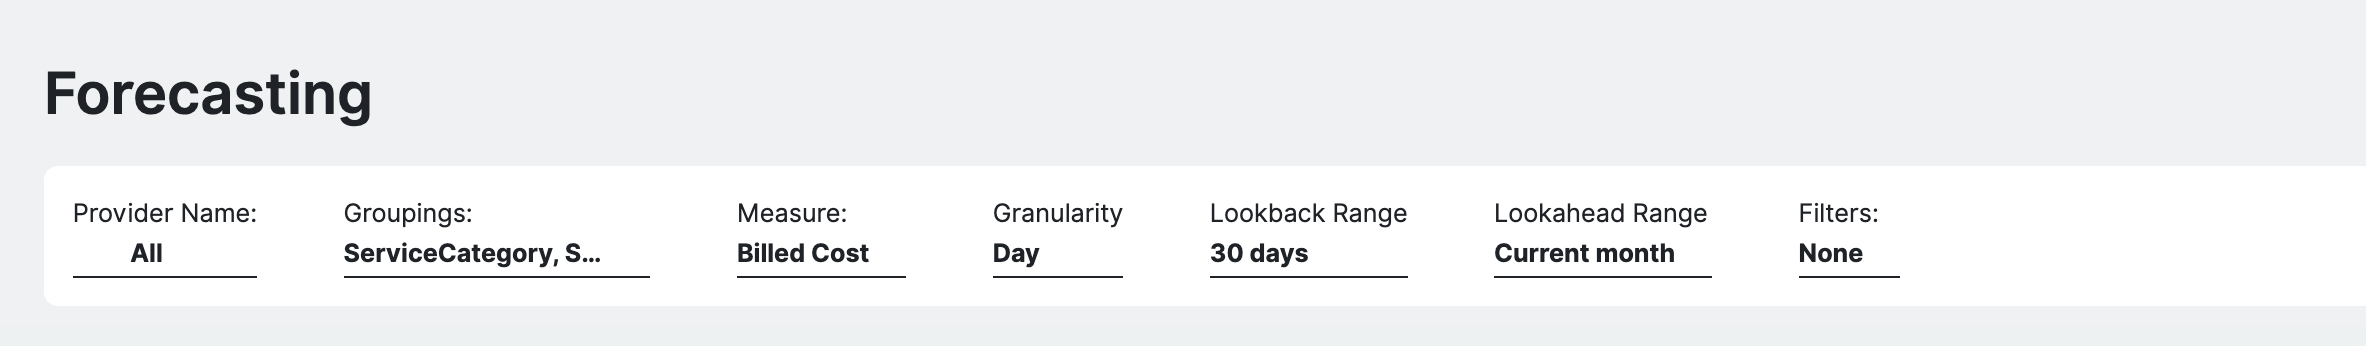
Step 1: Select the forecast scope
Forecasting includes all cost data from configured cloud service providers by default. Costs are broken down by category and service description to highlight primary spend drivers.
Step 2: Choose groupings, measure, and granularity
Groupings and measures can be adjusted to refine analysis by service, category, or other supported dimensions. Forecasts can be viewed at daily, weekly, or monthly granularity.
Step 3: Configure time ranges
Set a historical lookback period between 30 days and 24 months to define the data used for trend analysis. Choose a lookahead range between 1 and 24 months to project future spend.
Step 4: Interpret forecast visualizations
Actual spend for the current period is displayed in a darker shade, while forecasted spend appears in a lighter shade for visual separation.
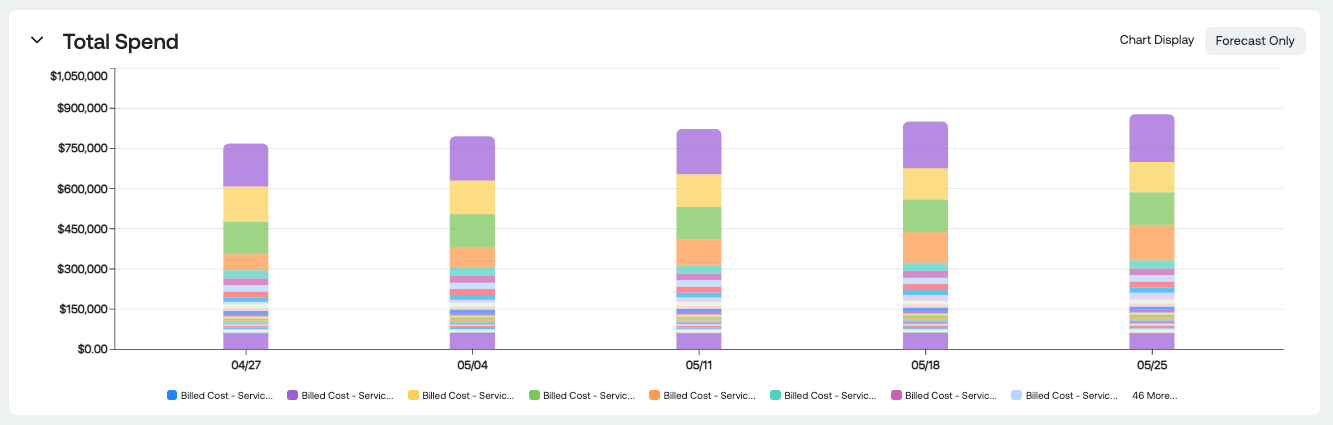
Users can switch between two views inside the graph:
- Forecast with Lookback (default)
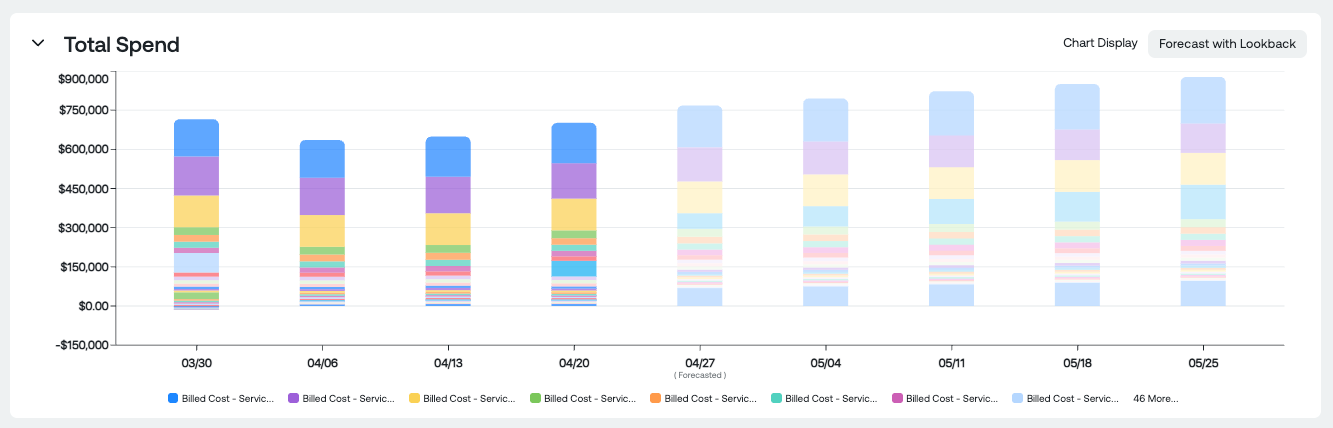
- Forecast Only views
Step 5: Review KPIs and detailed data
Above the chart, key performance indicators (KPIs) provide quick comparisons, including current period-to-date spend vs. previous period-to-date spend, estimated total spend vs. previous total spend, and forecasted spend vs. the average of the previous 3 months.

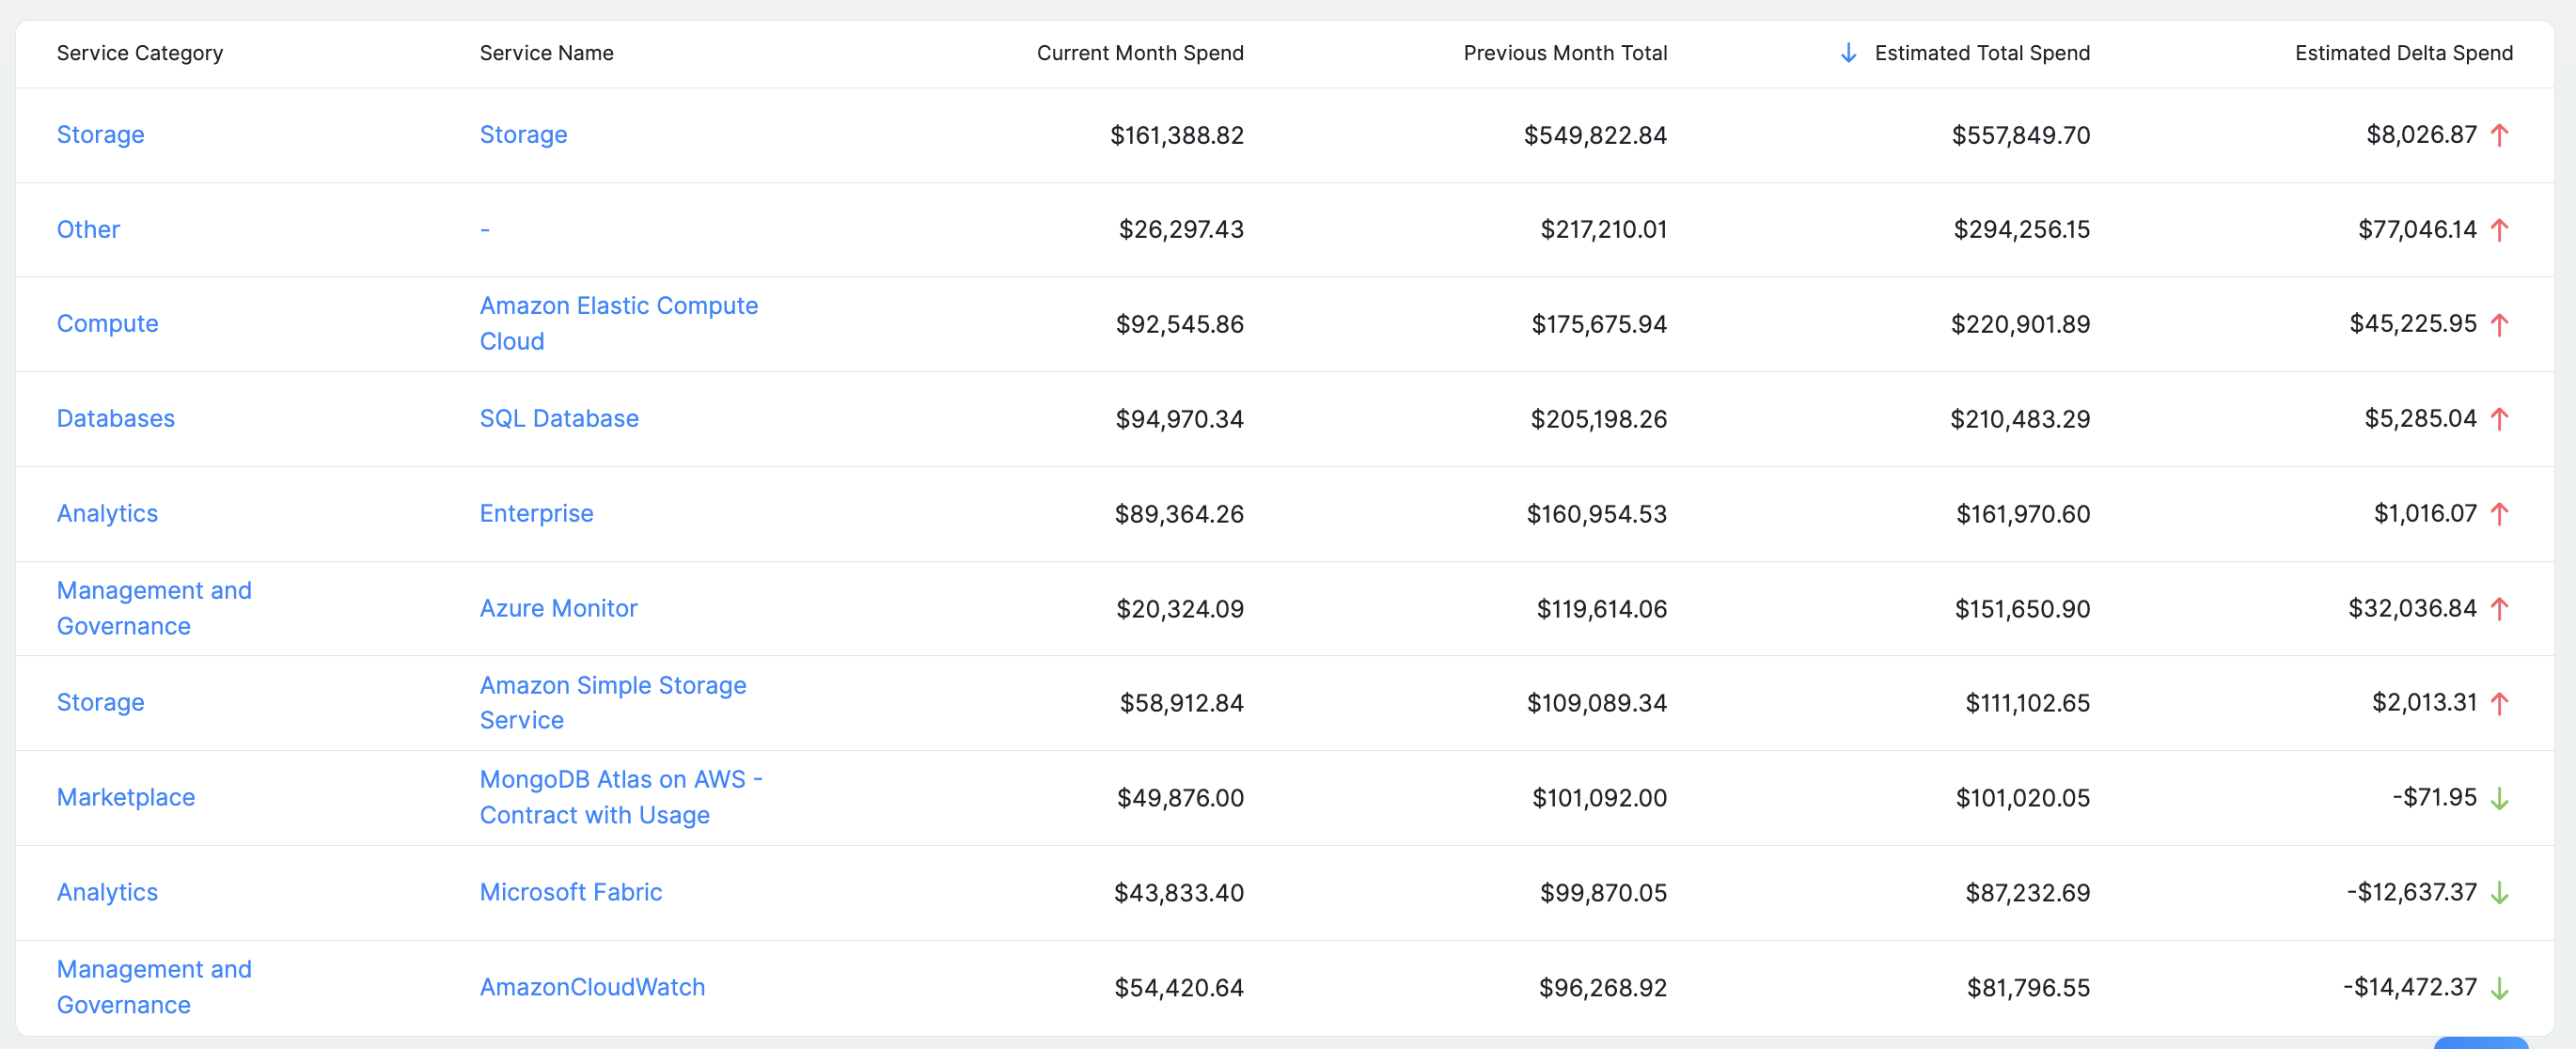
Step 6: Export
The table below reflects the selected configuration and includes current spend, estimated total spend, and delta values, which can be exported as CSV for further analysis.
Updated 6 months ago