Anomaly Detection
Overview
Detect unexpected changes or irregularities in cloud spend using machine learning-powered, human-tunable anomaly detection. Ternary identifies anomalies in specific categories (e.g., compute, analytics) as well as within individual projects. This article will guide you through setting up an anomaly detection alert rule and managing and investigating anomalies once triggered.
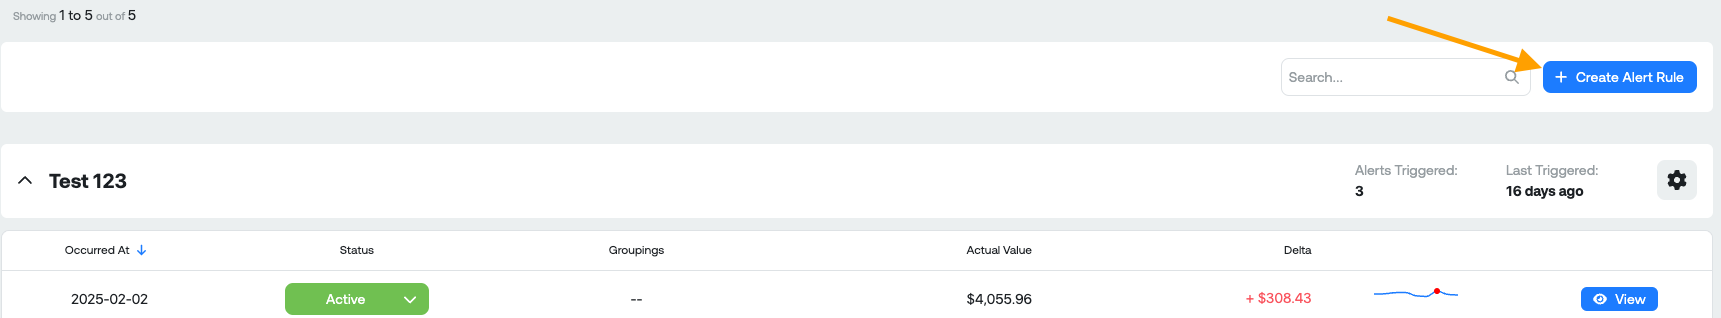
Create an alert rule
Ternary allows you to create custom anomaly alert rules.
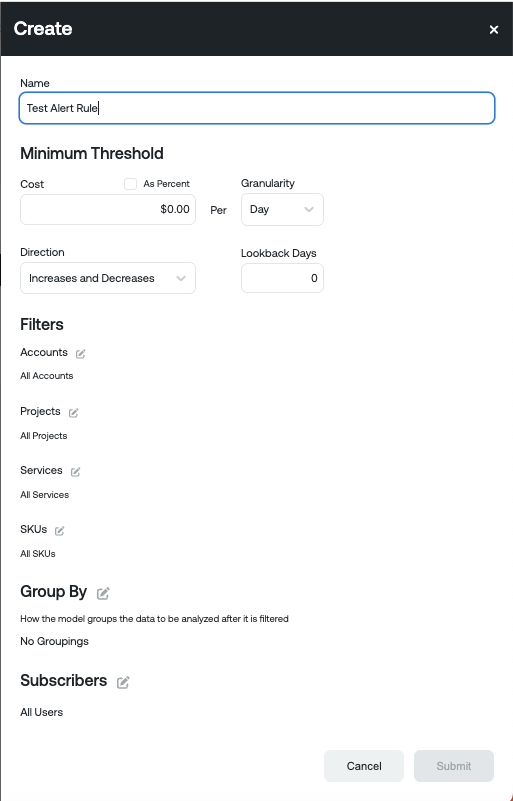
Configuration fields:
- Name: Name you create for the rule. We suggest using something descriptive such as "Ryland - $100 - Non-Production by Service" to describe what the rule is analyzing so others understand at a glance
- Cost or Percentage: Amount of cost you want to alert on such as $25, $100, $1000, etc. This is the threshold at which an anomaly will be generated based on the deviation outside the expected range. You can also select percentage to use a percentage deviation
- Granularity: You can set this to Day, Hour, Minute
- Direction: You can look for both Increases and Decreases, Increases only or Decreases only
- Lookback Days: The amount of days the rule will lookback to generate things that previously would have been identified had the rule been configured. 90-days is the maximum value for lookback days.
- Filters: Billing Accounts, Project IDs, Services and SKUs act as filters to filter the data set down that you want to analyze. For example, you can select a subset of projects, services or SKUs to filter the data set down too. We have customers, for example, who have created a rule to filter down to Production or Non-Production spend in separate rules as their threshold for production may be larger than non-production.
- Group By: After the data set is filtered down, the include labels field defines how the data is grouped by dimensions. You can use a label you have in your GCP environment, fields from the billing file, ternary specific dimensions and custom labels. For example, you may want to see deviations grouped by service. You would add serviceDescription to the include labels field.
- Subscribers: These are the individuals who will be notified when an alert is generated via e-mail. You can click edit subscribers to add or remove users. You also have the option to subscribe non-Ternary account e-mail addresses. For example, if you had executives who did not have an account in the tool or a distribution list you wanted the e-mail to go to.
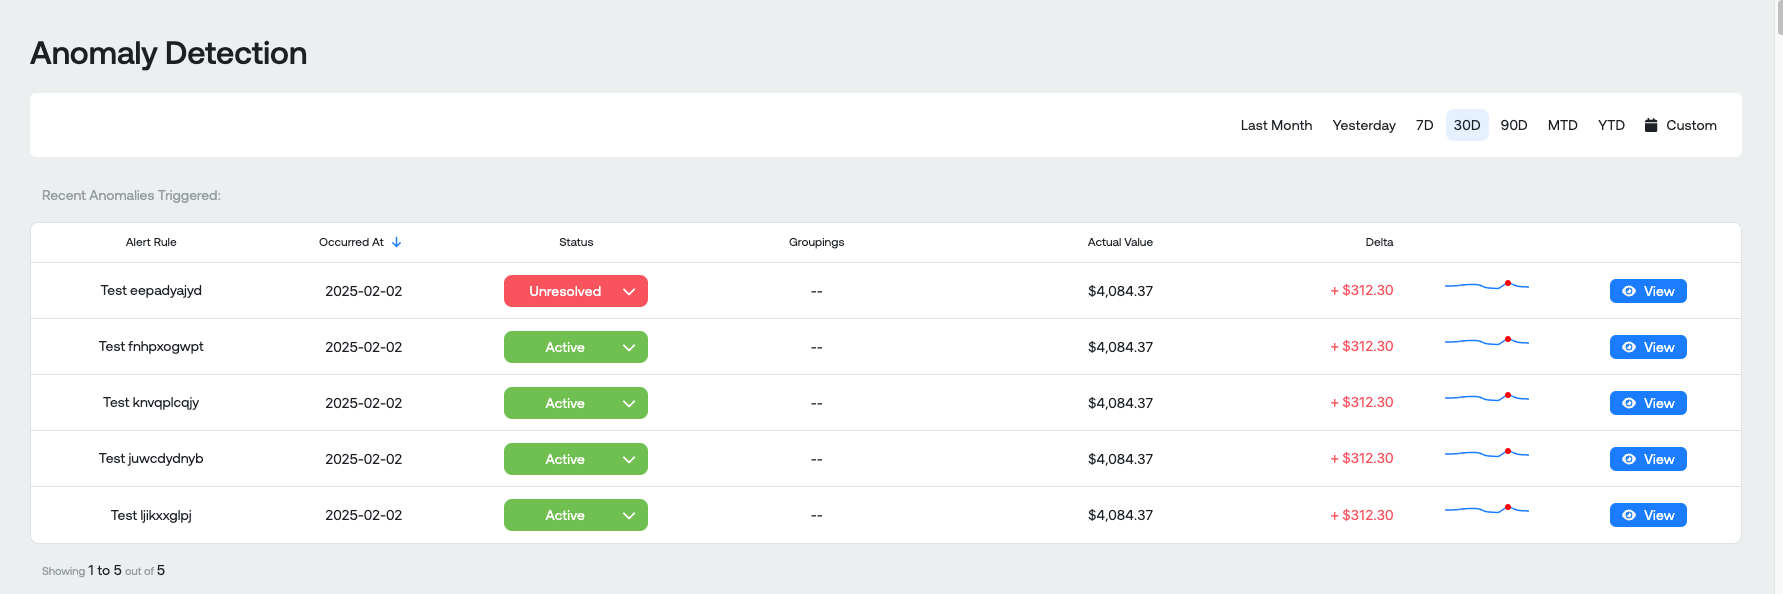
Recent anomalies detected
This section is designed to give you a list of your 5 most recent anomalies in your account in the form of a dynamic list of anomalies from system default rules or custom anomaly alert rules that you configure. The list will change to reflect your selected date range in the upper right date selection menu, the default is last 30 days.
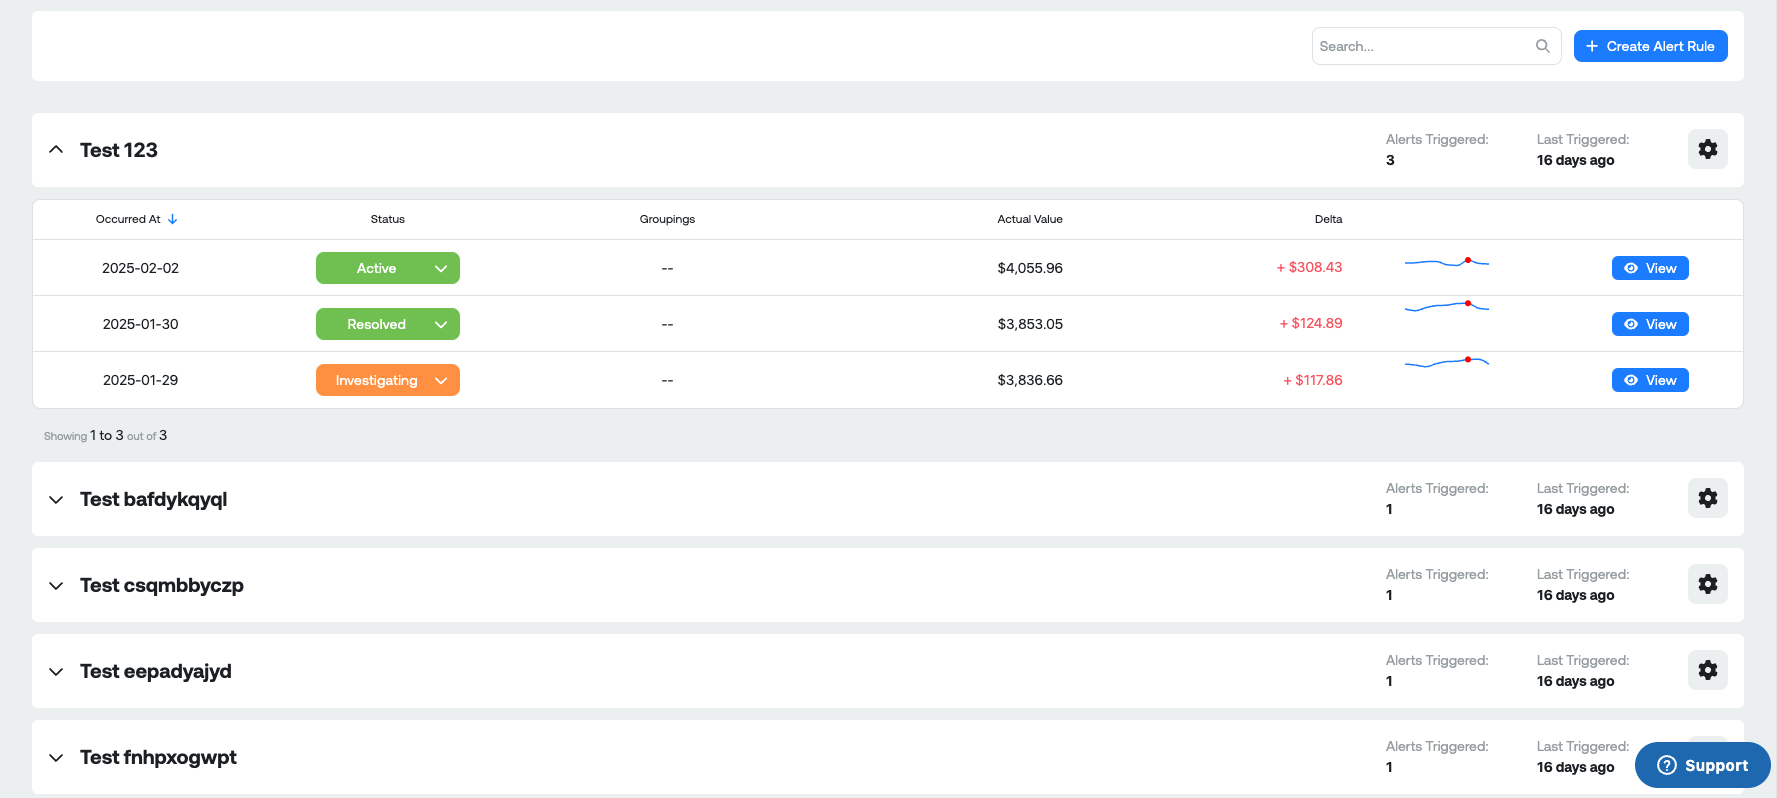
Anomaly groups
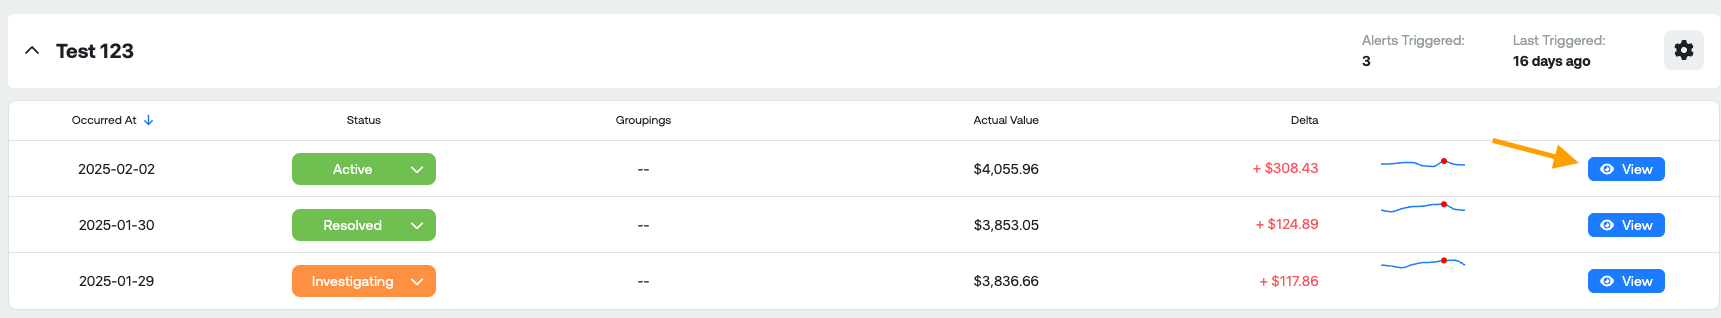
You will see a list of each anomaly configuration you have with the number of anomalies it has triggered during your selected time range along with the most recent anomaly date.
Status: Each anomaly event has a changeable status to help keep track of which anomalies need investigation or have already been actioned, the available statuses are (active, investigating, unresolved, resolved)
Each section is expandable to view additional details and a "view" button to see the specific information relating to a chosen anomaly event.
View anomalous event
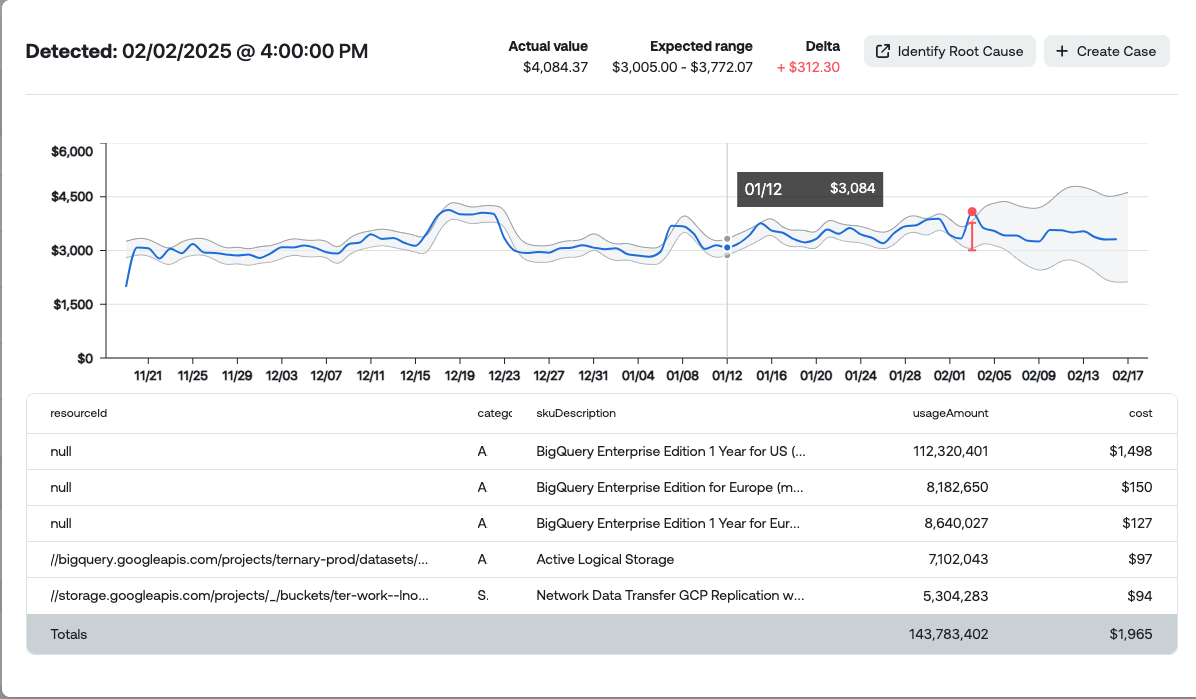
When you click the "View" button you can see additional details of the alert.
Key measures:
- Detected: Date and time the anomaly was detected, in Ternary.
- Actual Value: Actual cost on a single day for the anomaly event
- Expected Range: The expected lower and upper range for the last 90 days the model uses to identify an anomaly
- Delta: The difference of the actual cost and upper range of the expected range
Identify root cause: Ternary Anomaly Detection simplifies investigating the root cause of an anomaly. The “Investigate” button in the alert window directs you to a detailed report in the Ternary Reporting Engine based on the anomaly’s timestamp. You can refine the report using groupings and filters to more accurately isolate the root cause.
Create case: From the anomaly detection view you can also create a case. This case can optionally leverage our bi-directional Jira integration. Learn more about Ternary Case Management.
Chart: Here you will see the last 90 days of spend filtered for this anomaly configuration with the upper and lower range displayed in grey, with the actual spend being shown as a blue line. The anomaly event is displayed as a red dot on the blue line.
Table: Displayed below the chart is a table with the top 5 resources, grouped by category and sku description to get a quick preview of the primary cost driver for the anomaly with usage amount and cost for the day of the anomaly
Updated 3 days ago