Dashboards
Overview
Ternary offers powerful cloud cost transparency through its intuitive dashboard system, providing a comprehensive view of your cloud spending. Whether you're looking to get started quickly or tailor the experience to your specific needs, Ternary has you covered. You can leverage the Default Dashboard for a high-level overview, use the pre-configured System Dashboards for detailed insights, or create Custom Dashboards to track the metrics that matter most to your team. Explore these options to gain full visibility and control over your cloud costs.
Default Dashboard
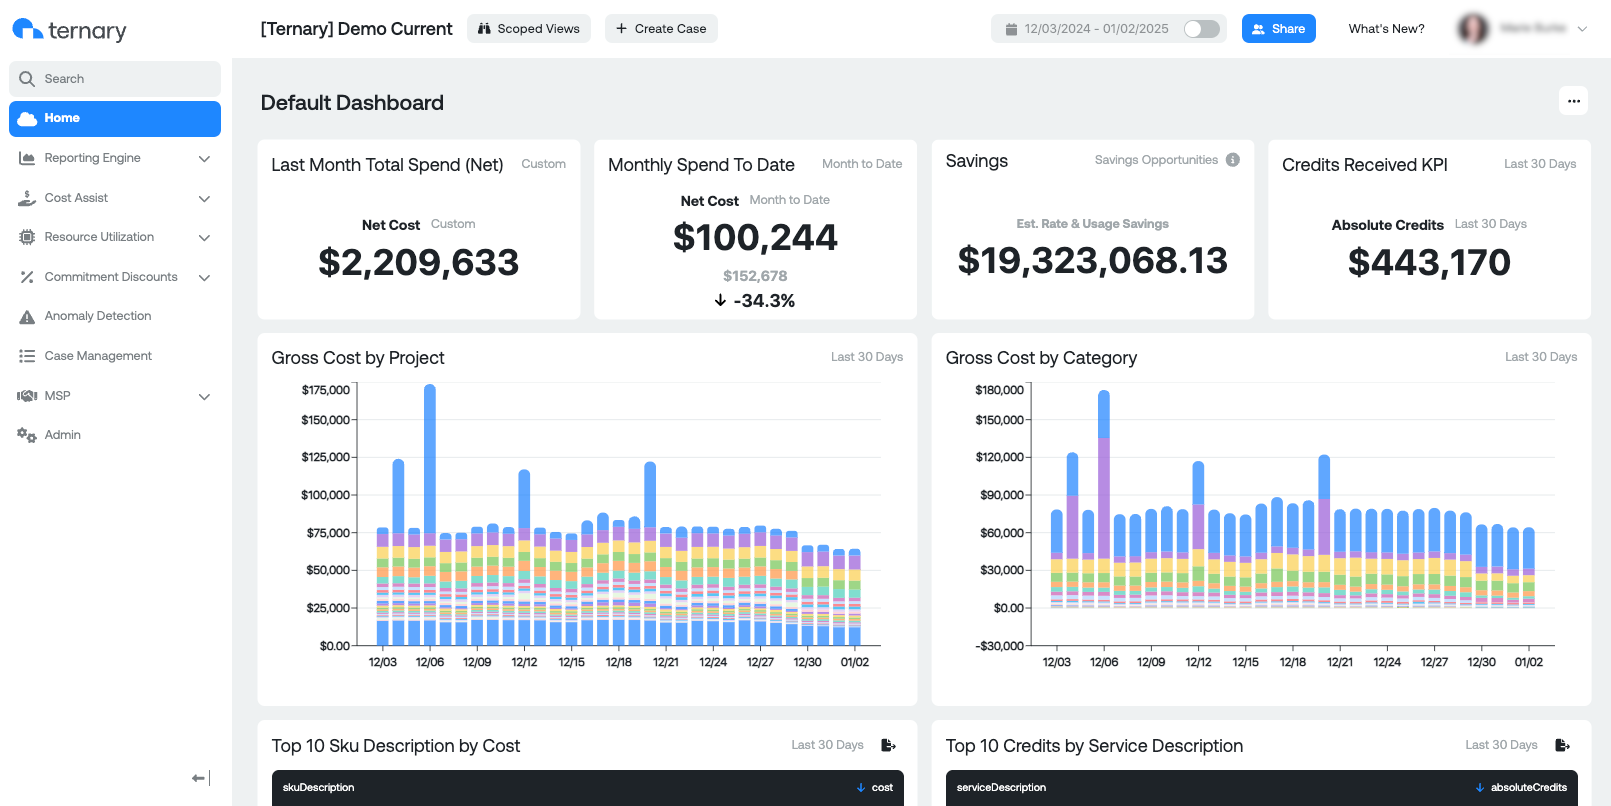
The Home Page in Ternary reflects the Default Dashboard. This dashboard provides a high-level overview of your cloud spend trends, helping you quickly understand your overall costs. It’s designed to offer easy navigation across different areas of your cloud spend, enabling you to visually identify opportunities for optimization and pinpoint the specific sources of those savings.

KPI widgets
- Last Month Total Spend: Your gross spend last month
- Monthly Spend To Date: Your gross monthly spend to date. The percentage shows your increase or decrease in spend this month to-date vs last month to-date.
- Savings Opportunities - This aggregates the potential savings from our Compute, Kubernetes and Storage Optimization Sections. Note: this is giving you a theoretical maximum if everything that is recommended were to be implemented. Read more how Compute, Kubernetes and Storage Optimizations work in Ternary here.
- Credits Received Includes any credits you have received from your cloud provider(s)
Scoped Views
Scoped Views allow you to apply a particular view with data filtered based on your business requirements and data taxonomy. For example, you may create a scoped view of Business Unit with a particular set of Project IDs associated to the Business Unit. By applying that Scoped View, the data on the corresponding Reports and Home Page Meters will be filtered to that set of Project IDs. Learn more about Ternary Scoped Views.
Create Case
Throughout the platform you can create a case wherever you see a paper & pencil icon with "Create Case" in the top toolbar. Learn more about Ternary Case Management.
Share
Additionally, the Home Page features a Share button, allowing you to collaborate with your team by sharing a unique URL to the dashboard / report you are viewing.
Default Dashboard Reports:
- Gross Cost by Category: This graph allows you to see your Gross Cost grouped by Category
- Gross Cost by Project: This graph allows you to see your Gross Cost grouped by Project
- Top 10 Credits by Service Description: This table shows you the Top 10 credits you've received from your cloud provider organized by service
- Top 10 SKU Description by Cost: This table shows you the Top 10 by cost SKUs
Dashboard Management
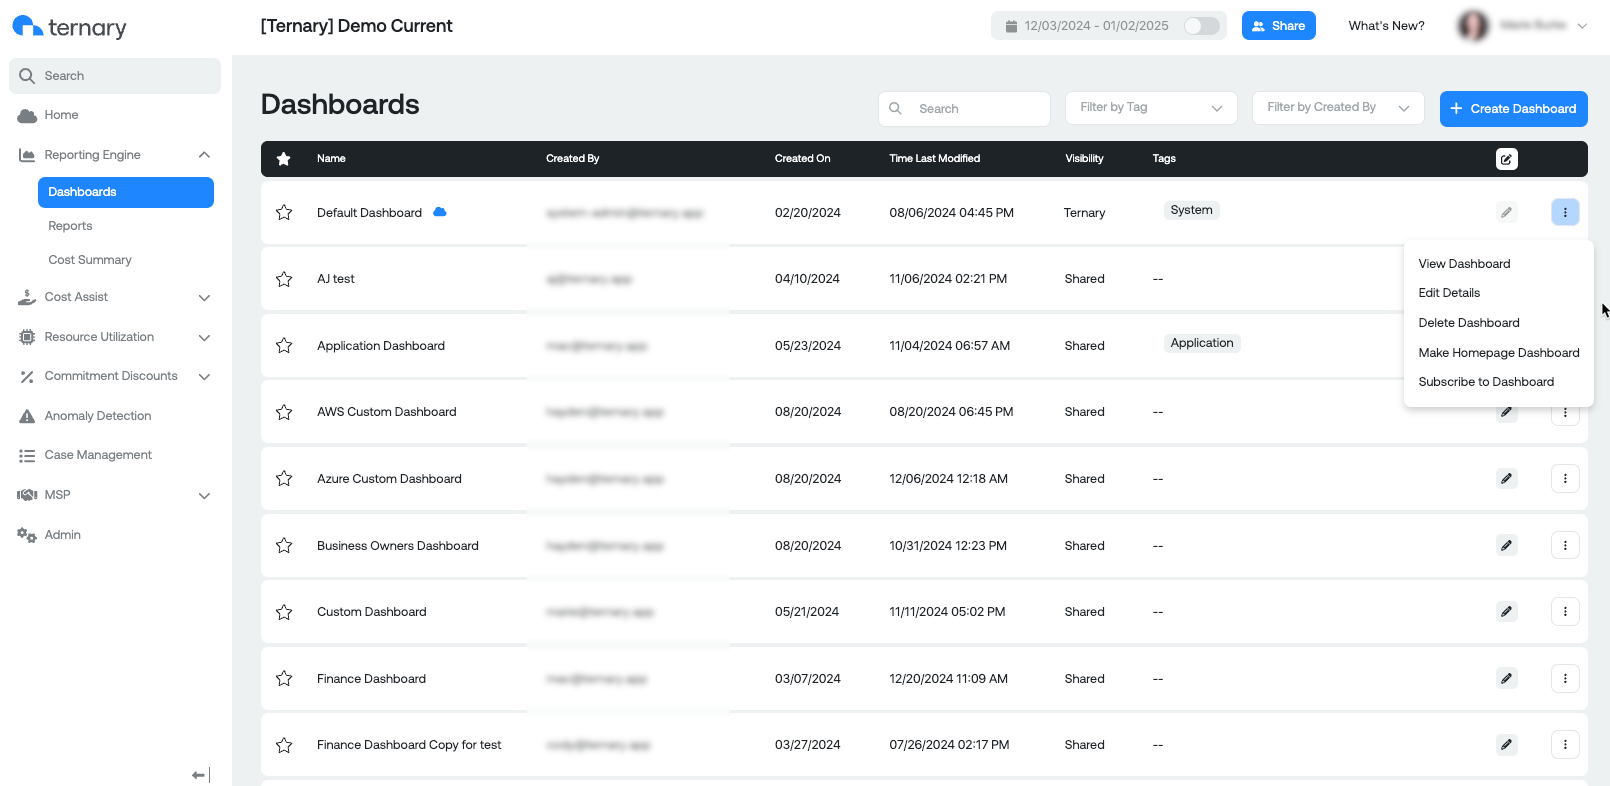
The Dashboard Management page, accessible under Ternary Reporting Engine > Dashboards, provides a range of options for managing your dashboards. By clicking the ellipses menu next to any dashboard, you can:
- View the selected dashboard.
- Edit the Details (name and tags) of an existing dashboard.
- Delete a dashboard you no longer need.
- Set as Homepage Dashboard to replace the Default Dashboard upon login.
- Create a Dashboard Subscription to receive email updates for any dashboard. You can set up subscriptions for both Ternary users and external recipients by entering email addresses. Customize the frequency (daily, weekly, or monthly) and specify the time for delivery. Multiple subscriptions can be created for the same dashboard.
Additionally, you can Favorite dashboards by clicking the star icon next to the dashboard name for quick access. These options provide full flexibility in organizing and collaborating with your dashboards.

System Dashboards
Ternary offers a set of System Dashboards that are available to all customers. These dashboards come pre-configured with commonly viewed cloud cost data, offering valuable insights right out of the box. You can use these dashboards as-is or copy and customize them to better suit your specific needs. To access System Dashboards, simply filter by Owner = [email protected] , Visibility = Ternary or by using the "System" tag. These dashboards provide a solid foundation for understanding your cloud spend and can be easily adapted for deeper analysis.
Custom Dashboards
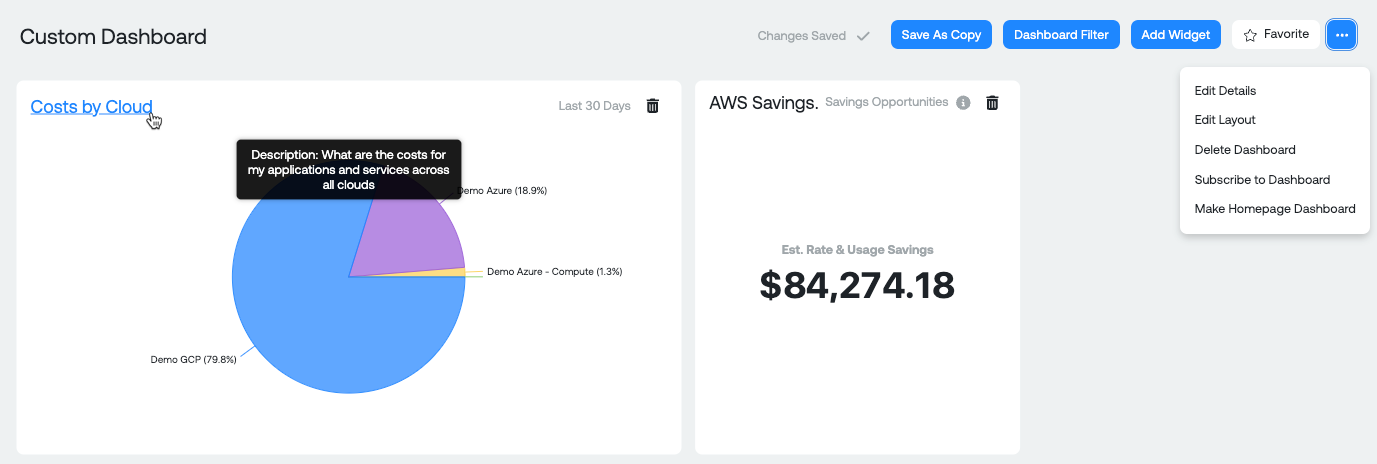
When creating a Custom Dashboard in Ternary, you'll have access to a range of management options through the ellipses menu, similar to the actions available in the Dashboard Management page. Additionally, several new features are available to enhance your custom dashboard experience:
- Save as Copy: While dashboard changes are automatically saved, this option allows you to create a copy of an existing dashboard for further customization without altering the original.
- Dashboard Filter: This feature lets you set a specific date range for the data displayed on your dashboard, giving you flexibility in analyzing trends over time.
- Add Widget: You can add various types of widgets to your custom dashboard, including:
- Report: Display a saved report.
- Budget (Daily Trends or Current Month): Track your cloud spend against your budget.
- Savings Opportunity KPI: View key performance indicators for potential savings.
- Realized Savings KPI: Track actual savings achieved.
You can add up to 16 widgets to a custom dashboard. Additionally, you can include Report Descriptions within widgets. Hovering over a report name within a widget will show the description; if no description is added, the full report name will appear instead.

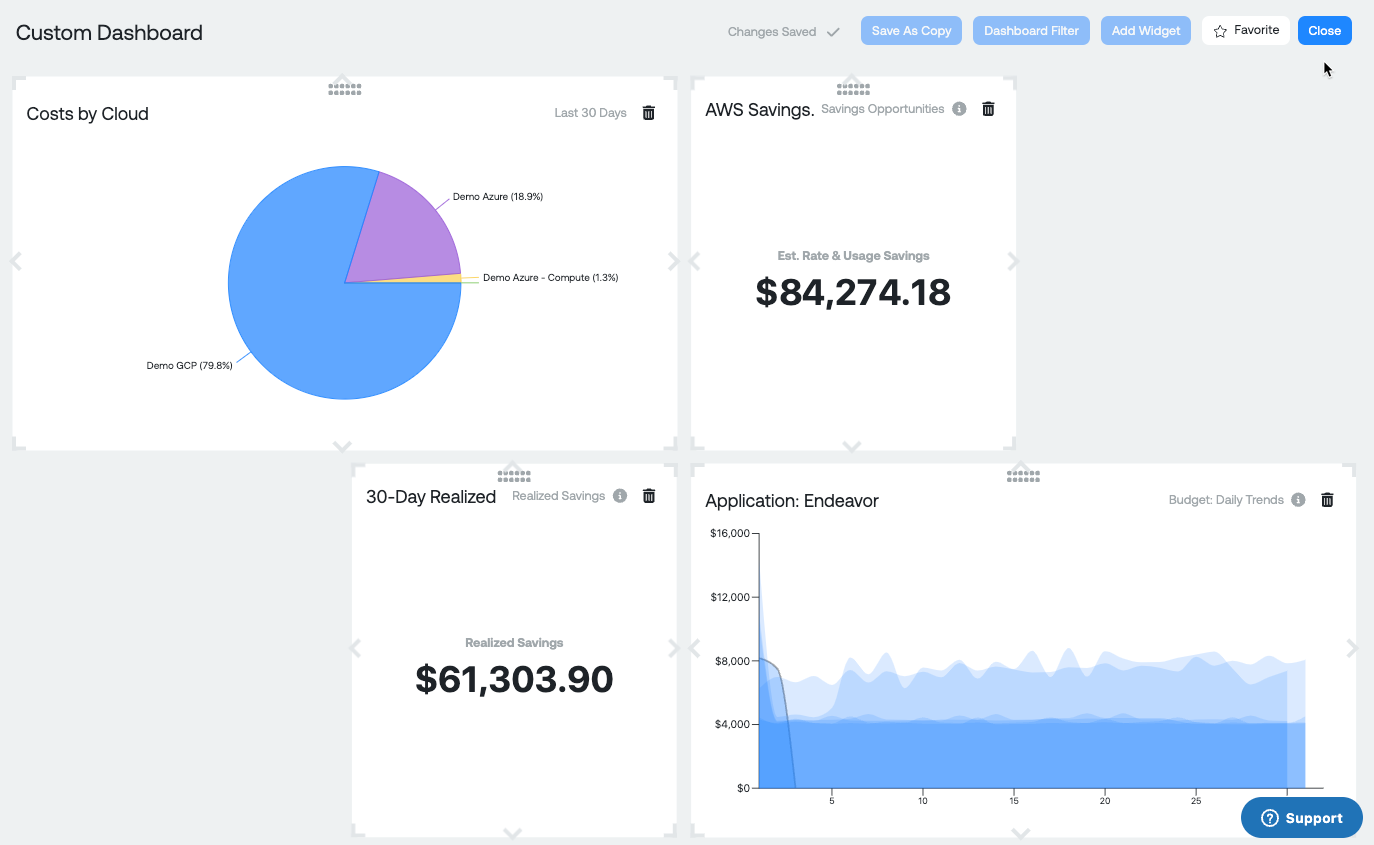
- Edit LayoutCustomize the layout of your dashboard by selecting Edit Layout from the ellipses menu. You can drag and drop widgets to rearrange them or resize them for a personalized dashboard design.

MSP Dashboard
For details regarding the MSP Dashboard, please view the MSP documentation: https://docs.ternary.app/docs/msp-dashboard
Updated 12 days ago
